How to use Content Analysis Grids
Set Up Project- Create the project and make sure to upload the discussion guide.
- Upload files (at least one). Content analysis grids will work with video, audio and transcript files only.
- Navigate to Analysis Grids in the left hand menu, and then to + Create New Grid in the top right hand corner of the grid page. Then, select ‘Content Analysis Report’.
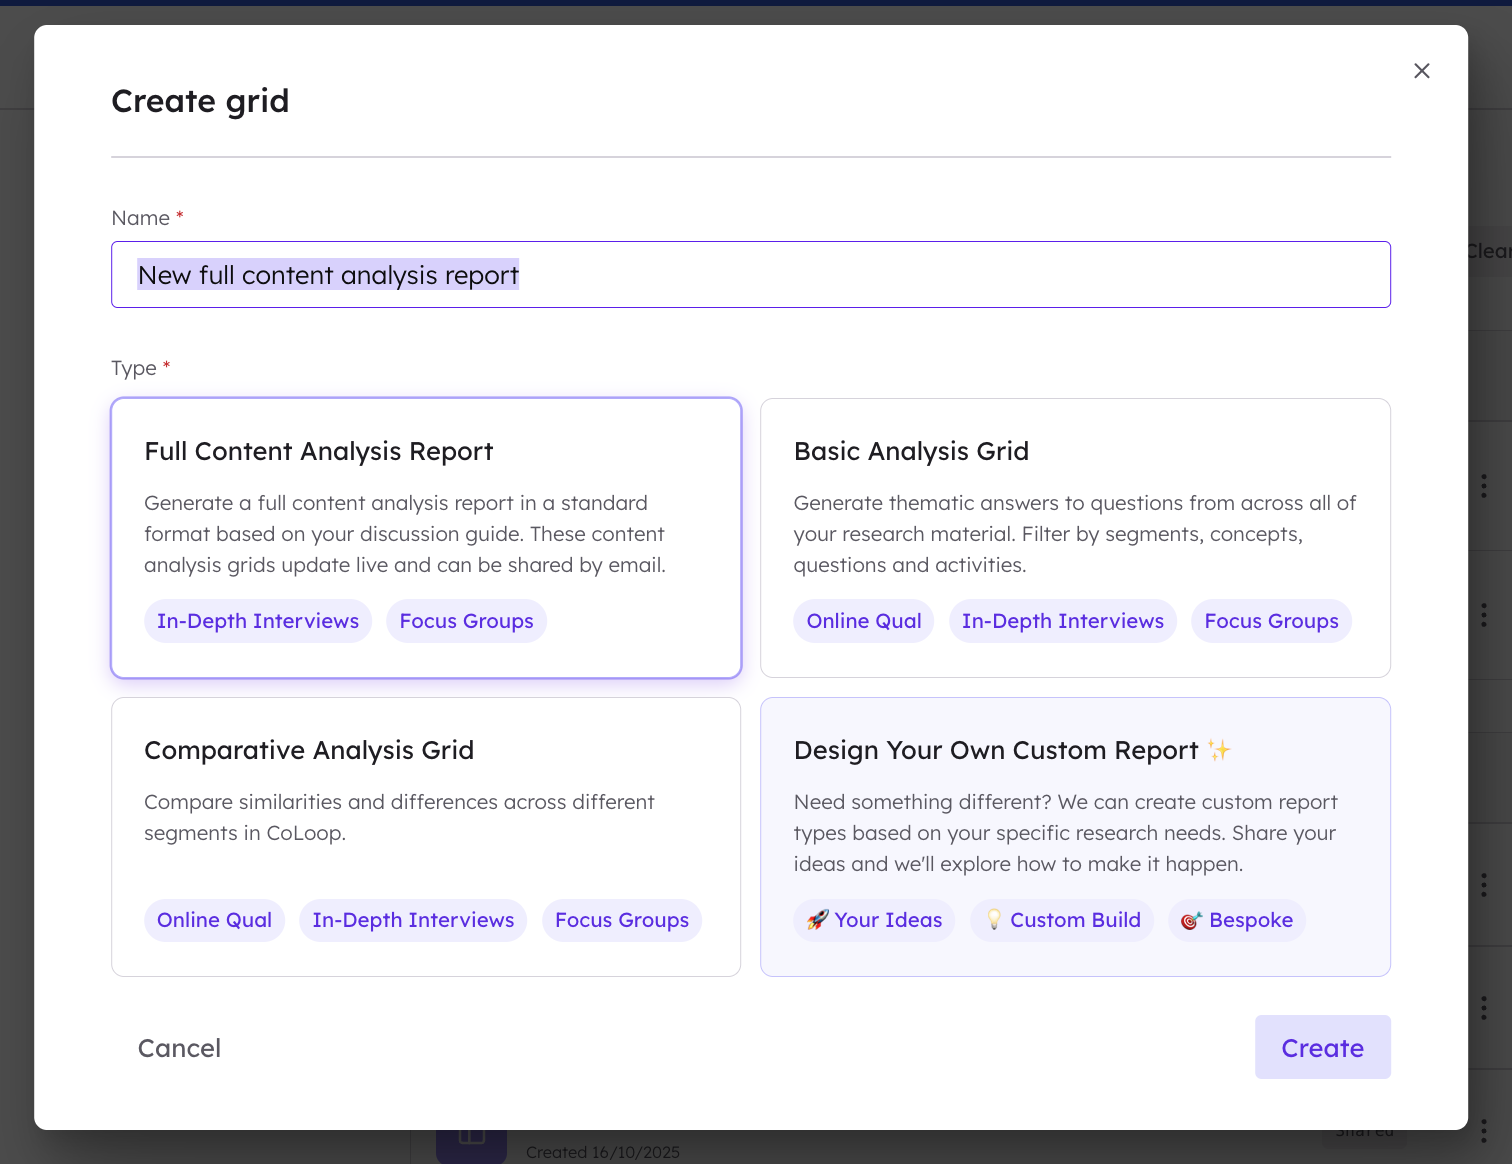
- Build your framework by either selecting ‘Initialize with AI’ (recommended), which will pull the questions from the discussion guide uploaded during project set up, or ‘Add Questions Manually’.
- CoLoop will automatically group probes/sub-questions under their related parent questions. Additionally users can drag and drop to reassign probes, reorder questions and edit question text if required.
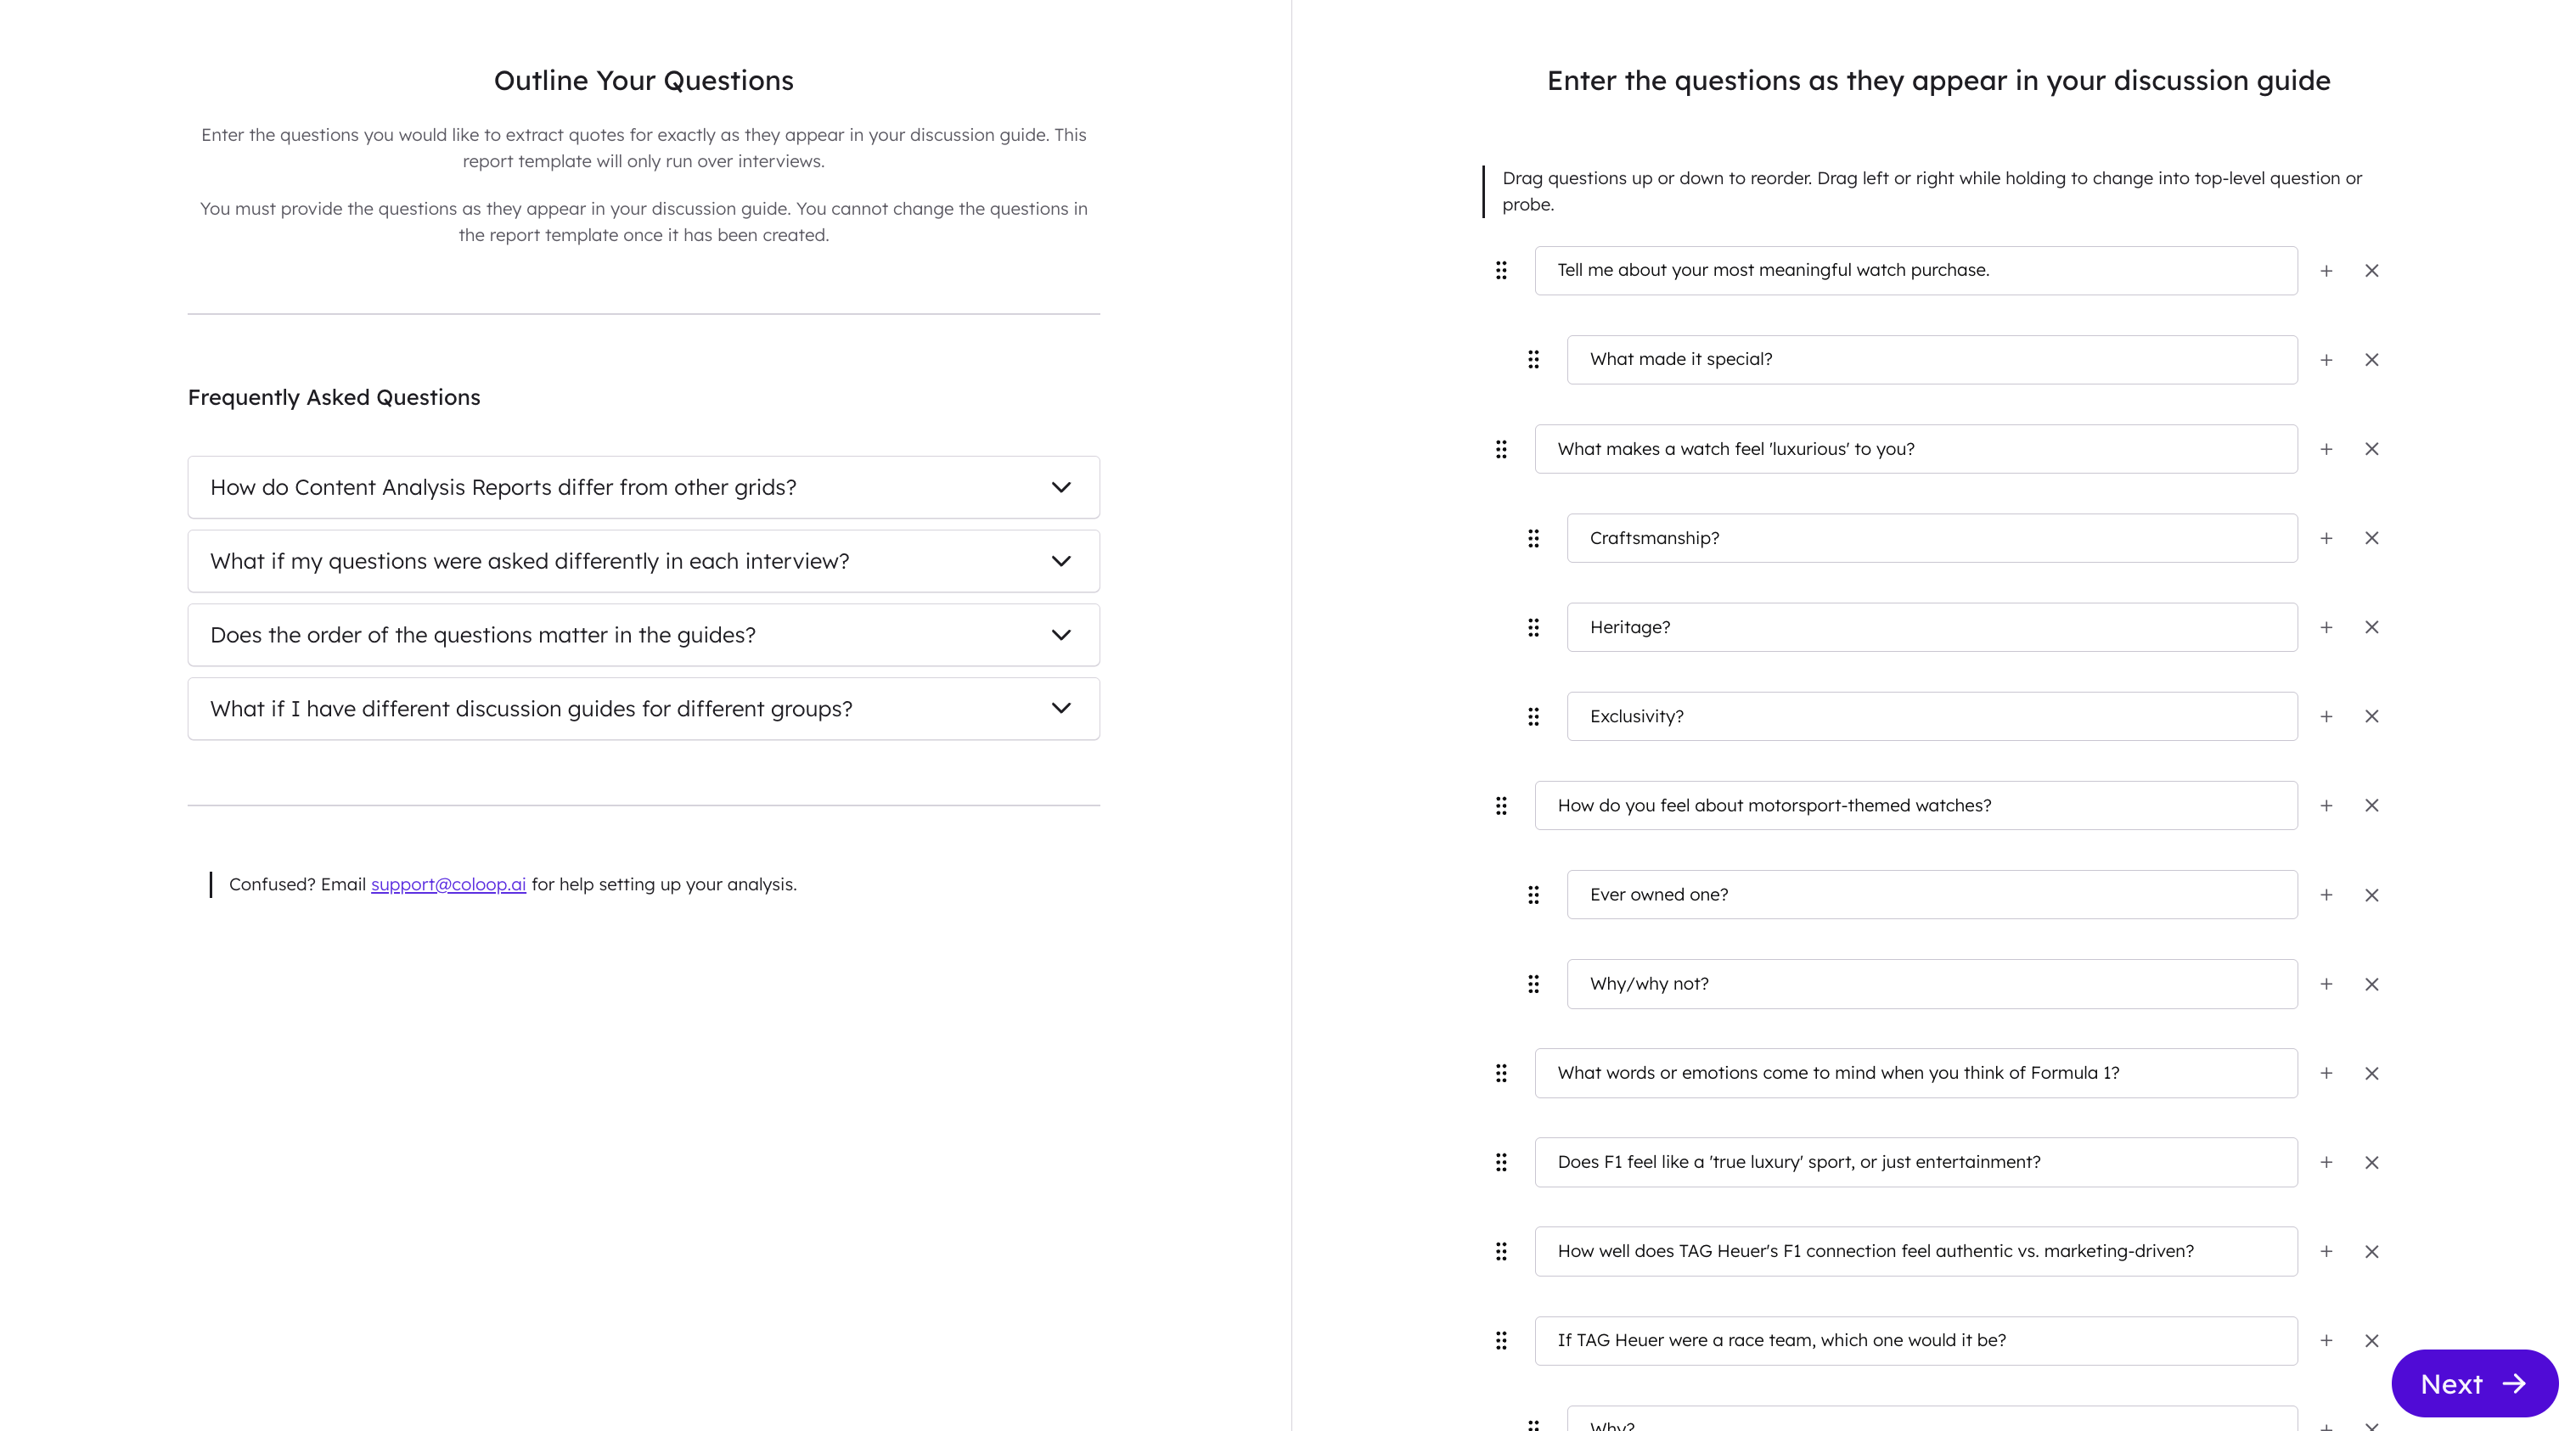
- When complete, press start. It is not possible to go back and edit discussion guide question structure after this.
- CoLoop may take a few moments to generate analysis.
- The analysis view has two sections you click between in the top left of the screen, the overview section and the quotes section.
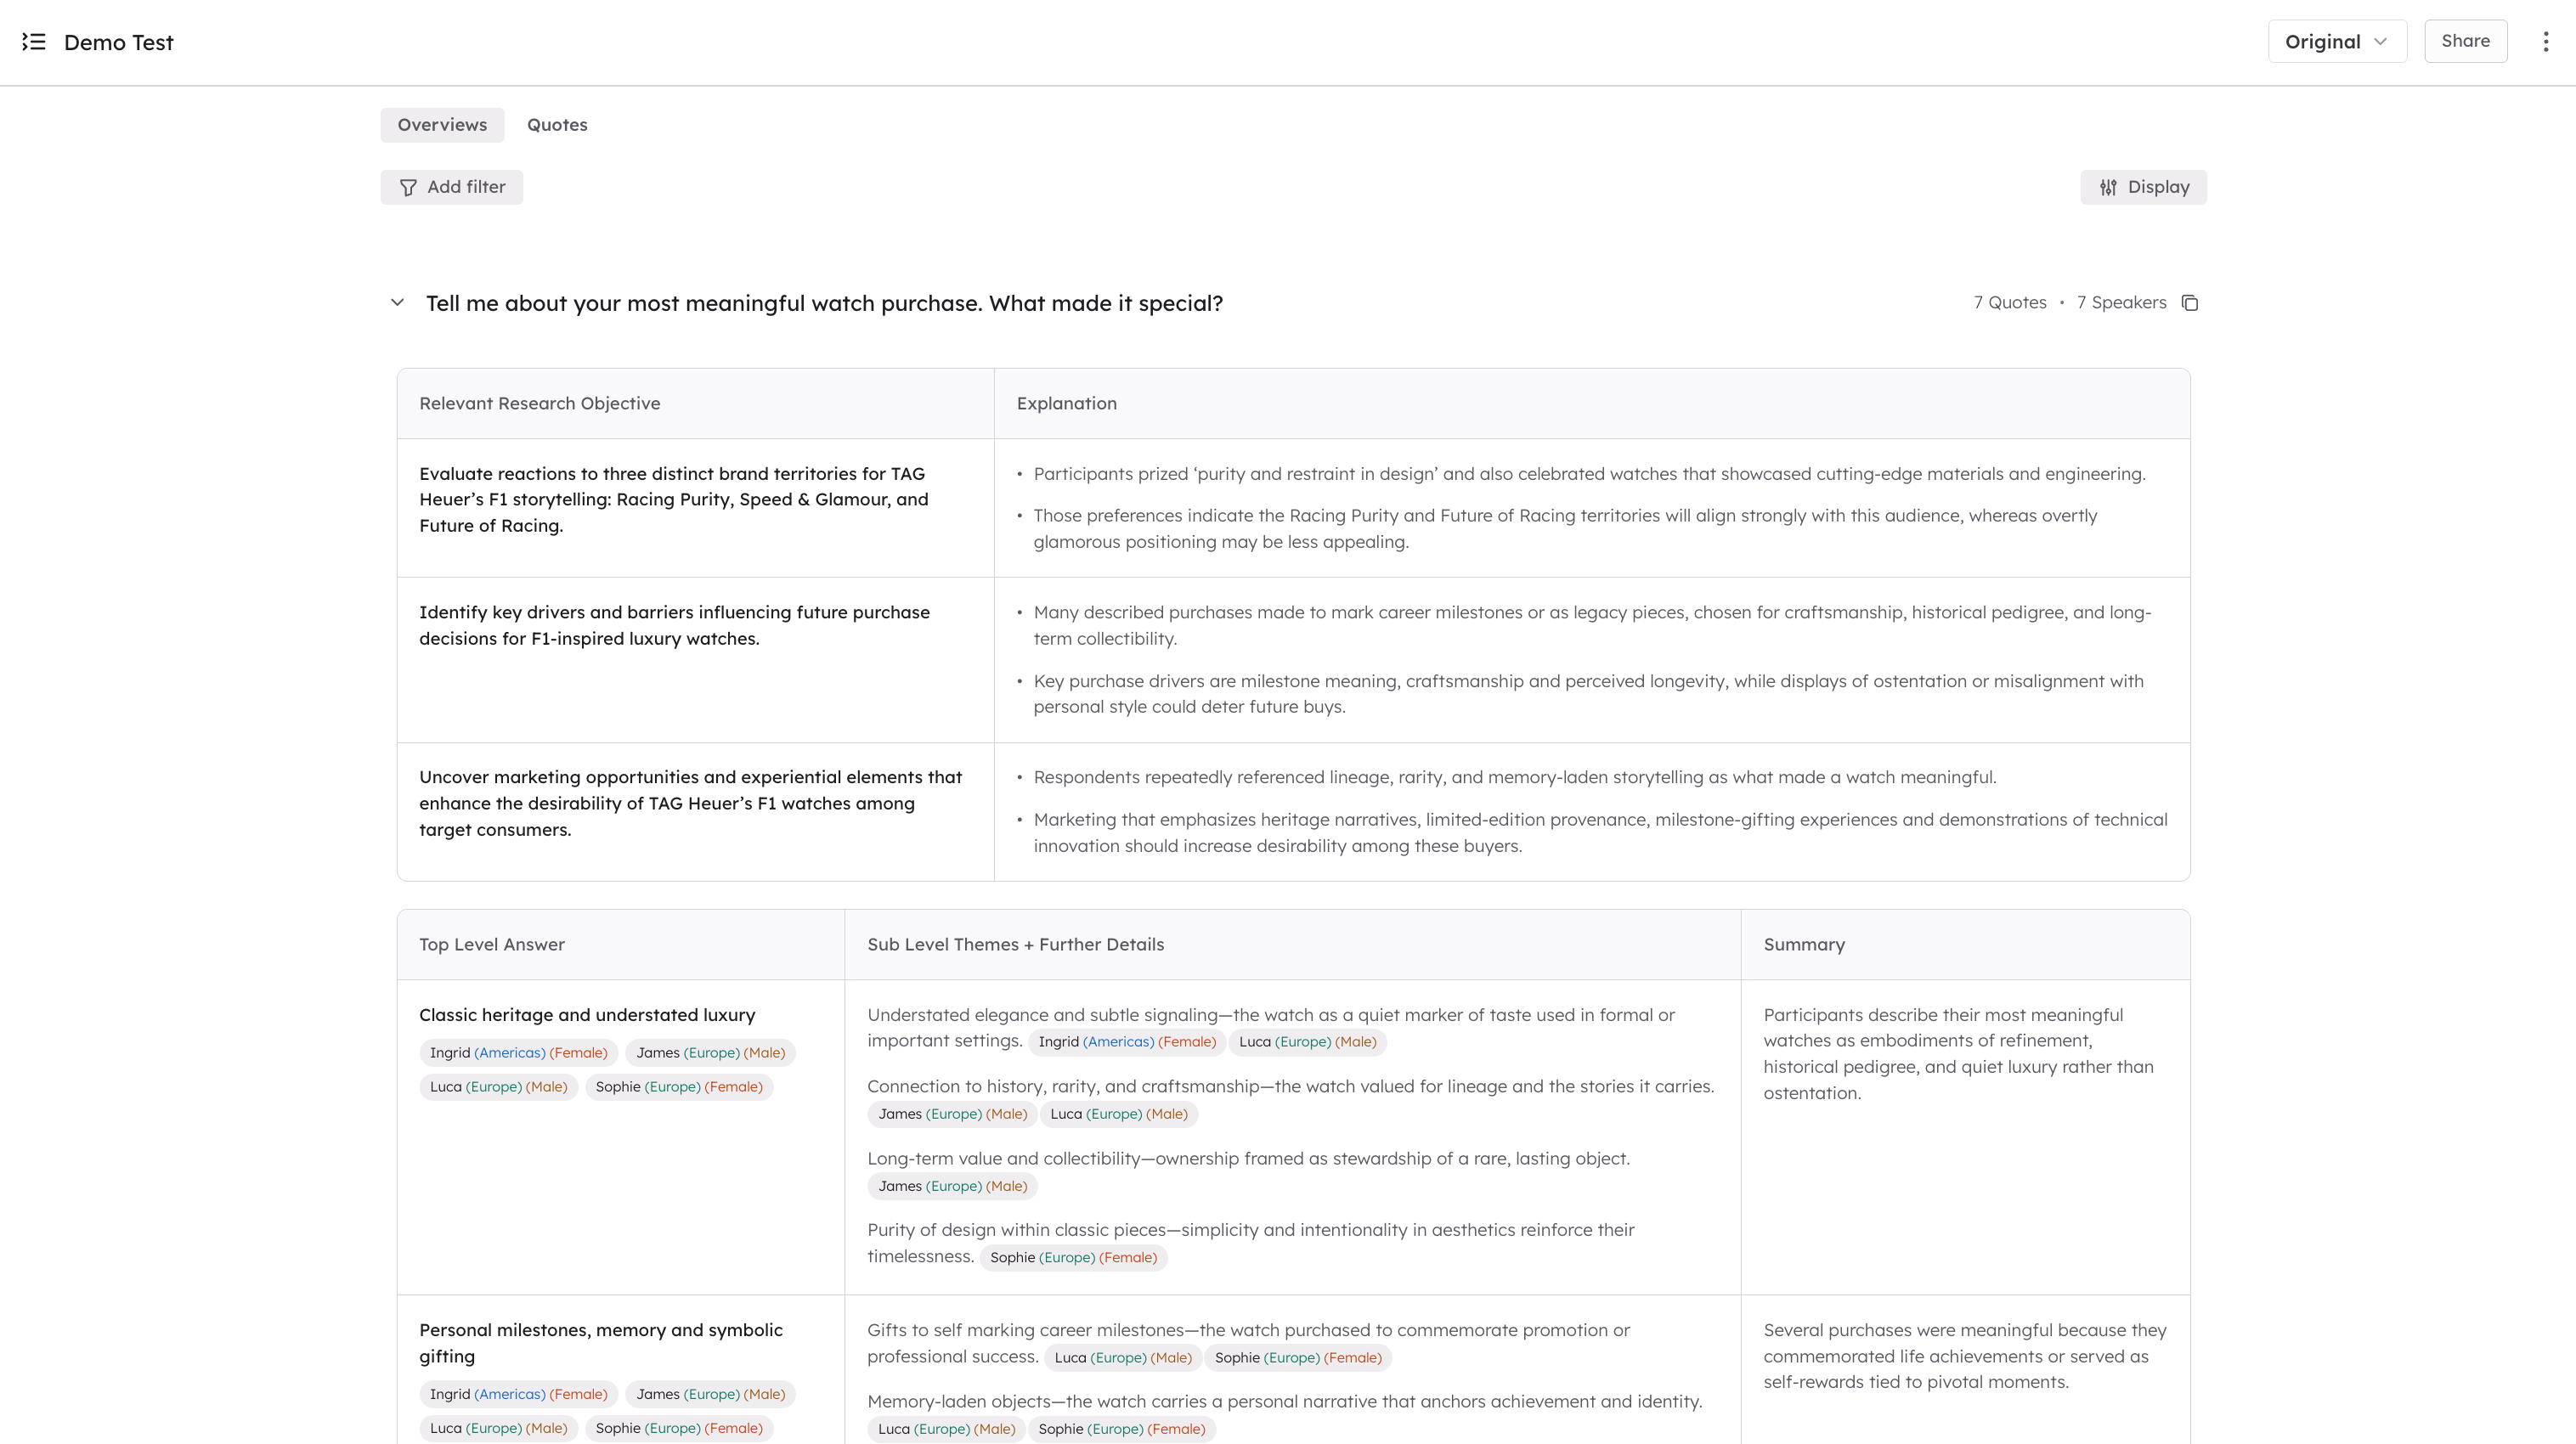 Overview Section: Click any dropdown next to a question to open its analysis. Under each question users will find a table with relevant research objectives and underneath that a content analysis grid.
- Research objectives: these are the objectives you confirmed during your project setup. CoLoop shows which research objectives link to each question. These can be toggled off for a cleaner view by clicking display in the top right hand corner.
- Content analysis tables: A top-level theme summarizing participants’ primary response pattern, sub-themes breaking down nuances and variations and a brief summary for quick interpretation. Participant names and their associated segments are display next to each point and clearly color-coded for easy visual scanning. Users can click on the themes or sub-level themes to open up the evidence panel. Quotes Section: Click on any dropdown next to a question to see associated quotes from each participant, in relation to the selected discussion-guide question.
- Use filters to breakdown analysis further. Users can filter by segment, individual participant or a combination of both. Filters apply to both the overview and the quotes sections.
- Use the share button at the top right hand corner to add colleagues to the project. Users can subscribe to a project to keep track of how insights evolve in real time as files are added to the project.
- Finally users can export the content analysis by clicking on the three dots in the top right hand corner to export as an excel, or the copy button next to each question.
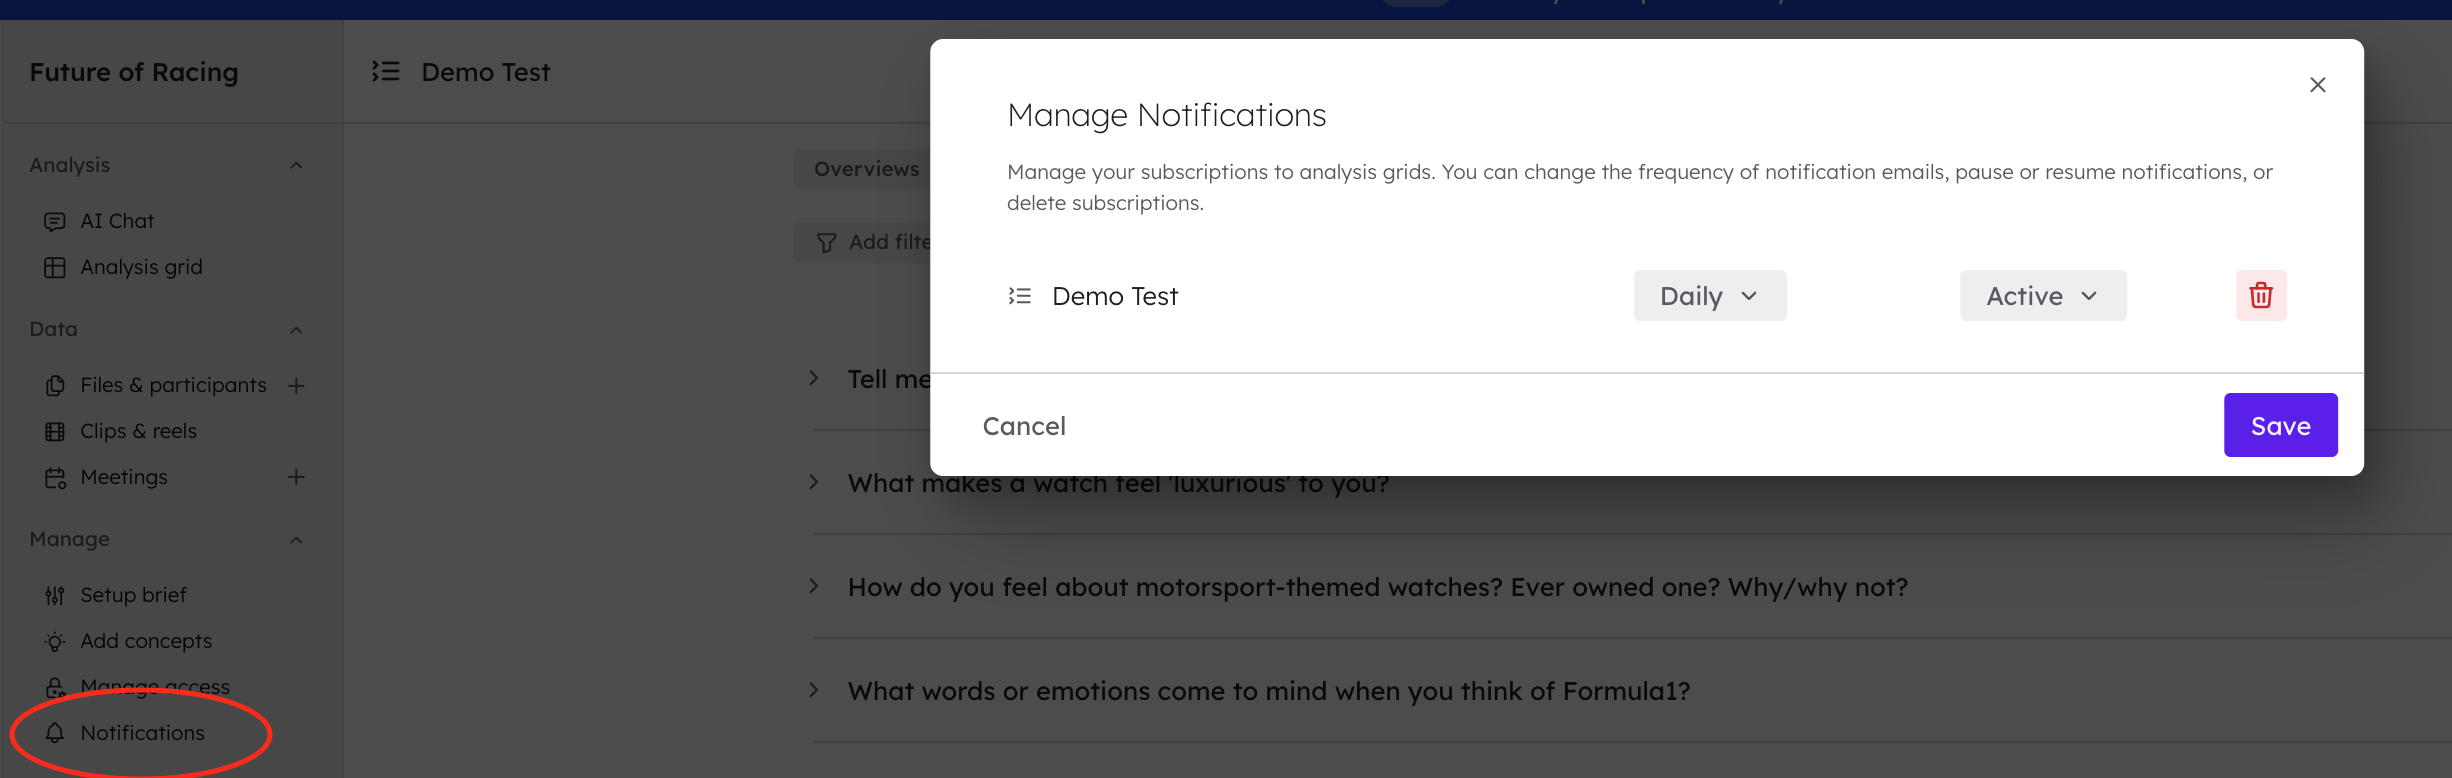
- Subscribe yourself, project members or other colleagues to the content analysis grids. They’ll receive real-time updates when new interviews are added.
- Users can choose to receive updates daily, once every three days or once a week. Manage notifications by clicking on the notifications button on the left hand menu.