Skip to main contentIntroduction
Chat 2.0 is the updated chat feature designed to make research analysis more systematic, reliable, and easy to use. It combines the structured workflow of grids with the flexibility of chat-based synthesis.
Unlike the previous chat, Chat 2.0 is reactive: it adjusts the way it works depending on the question you ask. For example:
- If you ask a quantitative question, it uses quant analysis tools.
- If you ask a conceptual question, it uses concept testing tools.
- If you ask a thematic question, it uses thematic analysis tools.
This ensures that the response is not only relevant but also based on the most appropriate method.
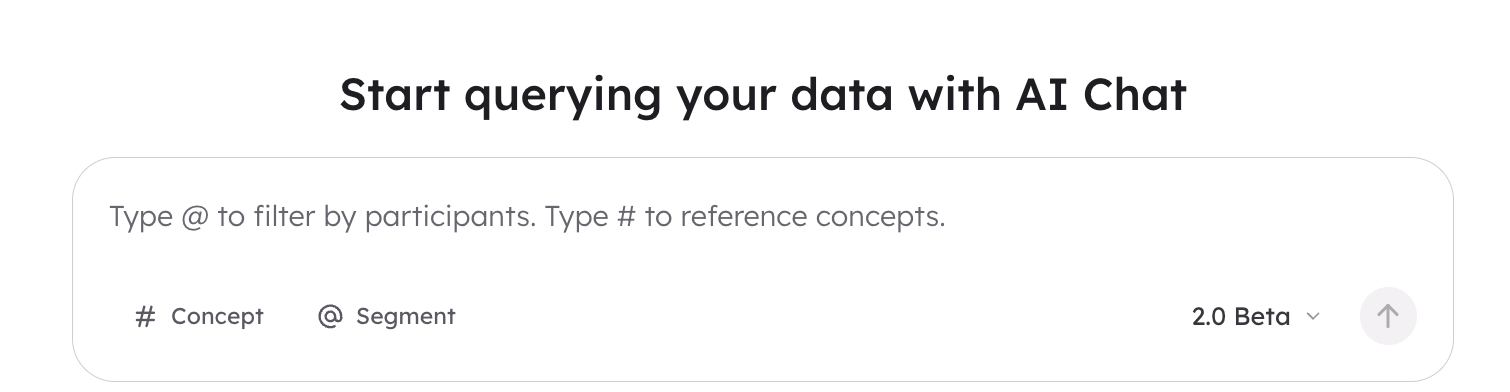
How to Use Chat 2.0
- Ask a Question
- Be clear and specific. Chat 2.0 will select the right analysis approach based on your question.
- For complex, multi-step research queries, the Chat 2.0 will create a to-do list showing the steps it will take and ask you to confirm before proceeding.
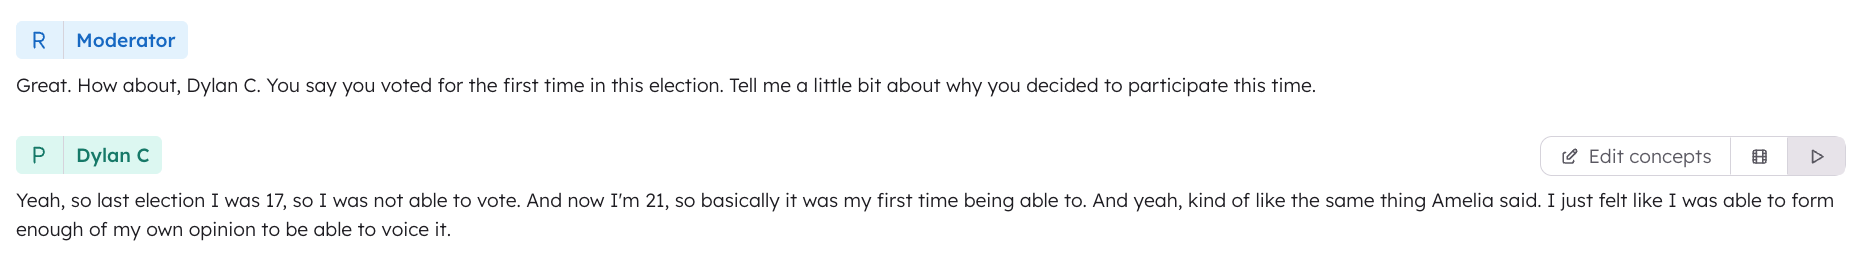
- Review Artefacts
- Chat 2.0 outputs artefacts—the answers to your questions.
- Every artefact includes citations, so you can check the supporting evidence.
- Use in Your Workflow
- Incorporate artefacts into your analysis and reporting.
- Always review citations to ensure the findings are well supported.
Best Practice Recommendations
- Use Chat 2.0 when you need comprehensive synthesis, quant comparisons and adaptive responses.
- Use Chat 1.0 only for lightweight exploratory work or when you want a quick scan without structure.
- Always review citations before using artefacts in reporting.
- Think of Chat 2.0 as a partner in structured analysis—you guide with the questions, and it provides systematic evidence-based outputs.
Examples of Prompts:
- Thematic breakdowns
- “Summarise the key themes in the data.”
- “Identify outliers in the data.”
- Participant-level comparisons
- “Find the similarities and differences between the Female and Male participants. Run two separate analyses.”
- Concept and stimulus reactions
- ”What did participants think about Concept A?”
- ”Breakdown perception of Concept A for segments X and Y”
- Quantitative counts
- “How many participants mentioned XX in their response?”
- “How many people knew about YY?”
- Journey mapping
- “Analyse participants’ decision-making in XX?”
- “What part of the process did participants find the most difficult?”
- Segment-based analysis
- “What are the key pain points per segment?”
- “What segments can you find in the data, aside from the ones I’ve already labelled?”
- Evidence retrieval
- “Find evidence supporting the hypothesis that participants thought XX about YY.”
- Quote Retrieval
- “Give me 2 quotes from every participant in segment Y”
- “Give me 1 quote from every female participant about what they liked about concept A”
- Categorisation Question
- “Break down the participants into part time and full time workers”
- “Break down the participants by the days of the week they work”
- Comparative Analysis
- “Compare and contract Segment A and Segment B on customer satisfaction”
- “What do engineers and designers have in common regarding work-life balance”
Additional Capabilities
As well as texted based outputs, Chat 2.0 will also output thematic tables, numerical responses with proportion bars, sentiment tables for concept testing, and bar graphs and pie charts with data you can copy straight into excel.
Thematic Analysis: Tables
- Example Prompt: “What are the top 5 themes related to participant voting behaviours?”
 Qunatiative Queries: Numerical Outputs & Proportion Bars
- Example Prompt: “How many participants said their families influenced their voting decisions?”
 Concept Testing: Sentiment Tables
- Example Prompt: “Conduct concept analysis on #Novartis”
 Categorisation Questions: Bar Charts & Pie Charts with Copy-Ready Data
- Example Prompt:
- Pie Chart (mutually exclusive): “Break down participants by part time and full time workers”
- Bar Chart (not mutually exclusive): “Break down the days of the week participants worked”
 You can then click on the copy button (the overlapping box icon), and then paste the underlying data into excel to replicate the chart yourself.
 Comparative Questions: with strength scores across similarities and differences
Ask for similarites, differences or both across segments across one variable. You’ll get a table output with key similarities or differences per row, and a strength score which indicates the universality of the similairty or difference.
Comparative Questions: with strength scores across similarities and differences
Ask for similarites, differences or both across segments across one variable. You’ll get a table output with key similarities or differences per row, and a strength score which indicates the universality of the similairty or difference.
- Example prompts:
- For Similarities: “Find similarities between Segment A and Segment B on customer satisfaction”
- For Differences: “What are the differences between power users and casual users regarding feature requests?”
- For Both: “Compare and contrast Segment A and Segment B on product usability”
What if Chat 2.0 Says is Can’t Fulfil My Request or It Breaks?
- If Chat 2.0 says is can’t fulfil your request, it means that functionality hasn’t been built in yet. Try re-phrasing the question, or breaking it down into something simpler.
- If Chat 2.0 fails or does not work correctly, please contact support and send a screenshot of the error and the link to your chat.
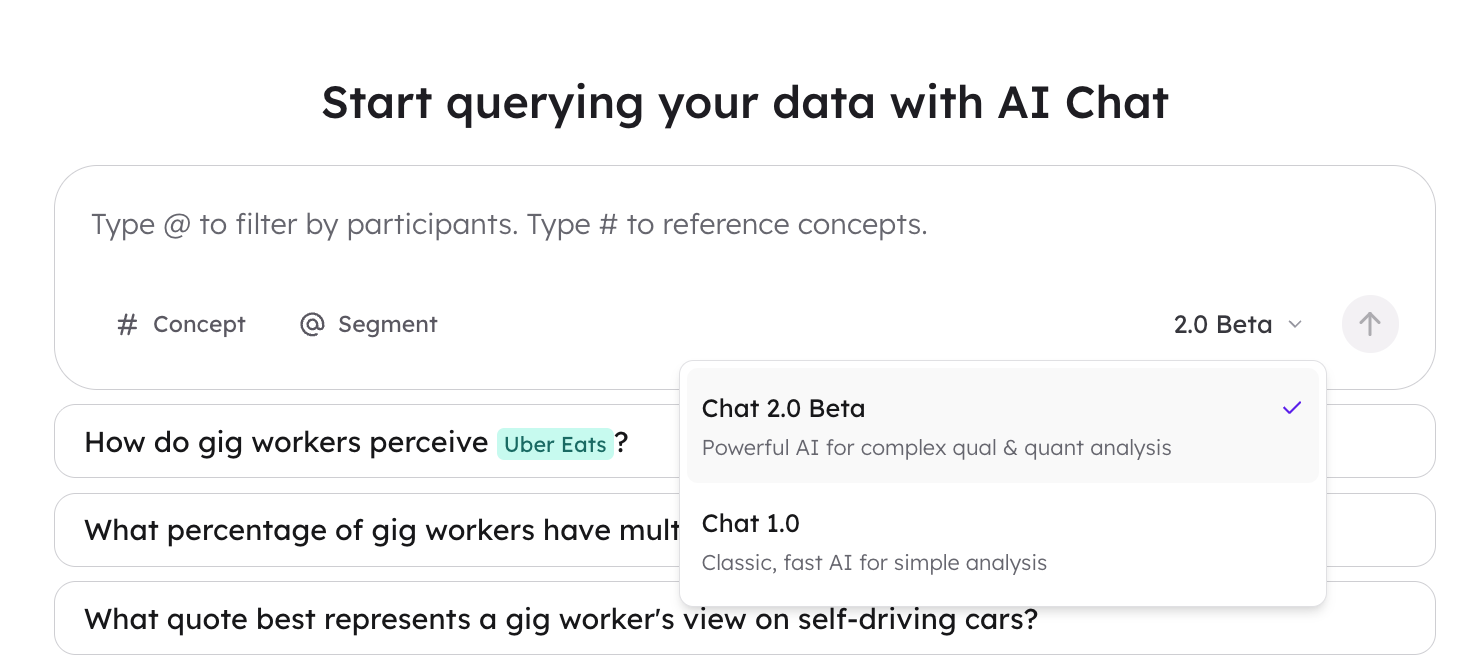
What if I want to switch back to Chat 1.0?
To switch back to Chat 1.0, create a new chat and click on the drop down arrow next to ‘Chat 2.0’. This will open a drop box which will let you select Chat 1.0.