If you’re importing data from Recollective or Incling, check out these articles. The segments will be brought in immediately!
Segments allow you to group research participants by customer type, demographic, market or other factors to enable filters and comparisons during analysis. You can apply segments manually, or import an Excel Sheet with screener questionnaire data.

Manual Entry:

  • In the
  • Create custom segment labels (e.g., “Region: UK”, “Age: 18-24”).
  • Assign them to participants by ticking on the left.
  • You can allso

File Name Filtering:

  • If filenames contain metadata (e.g., “Interview_UK_Youth”), filter by keyword and bulk-assign segments.
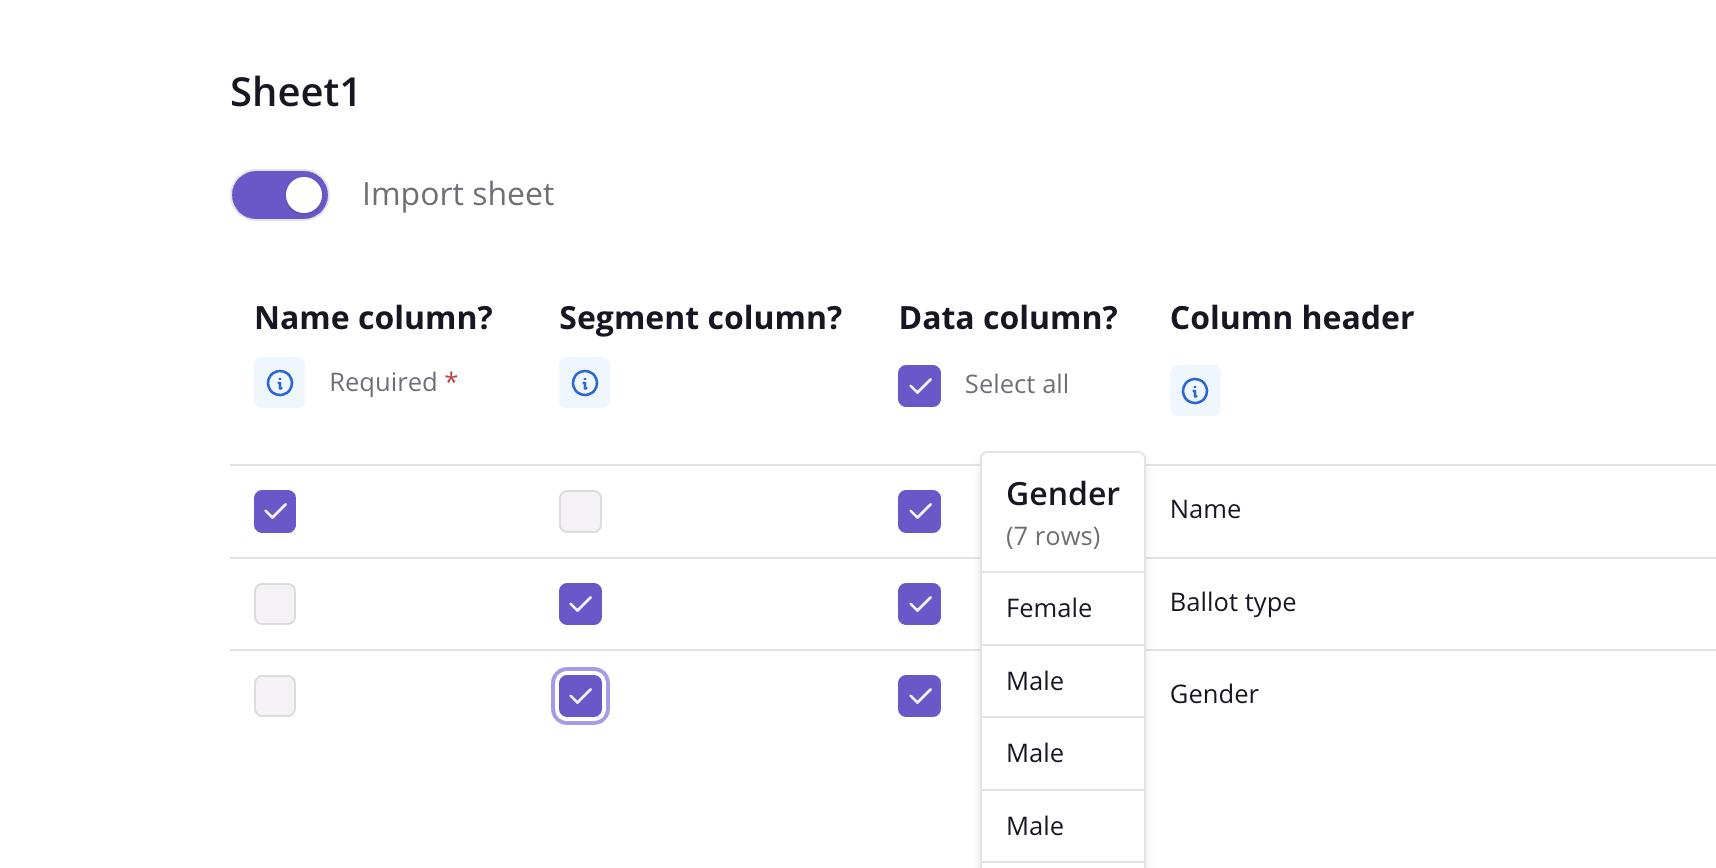
Excel Import:

  • Upload an Excel sheet containing columns for names and demographic fields.
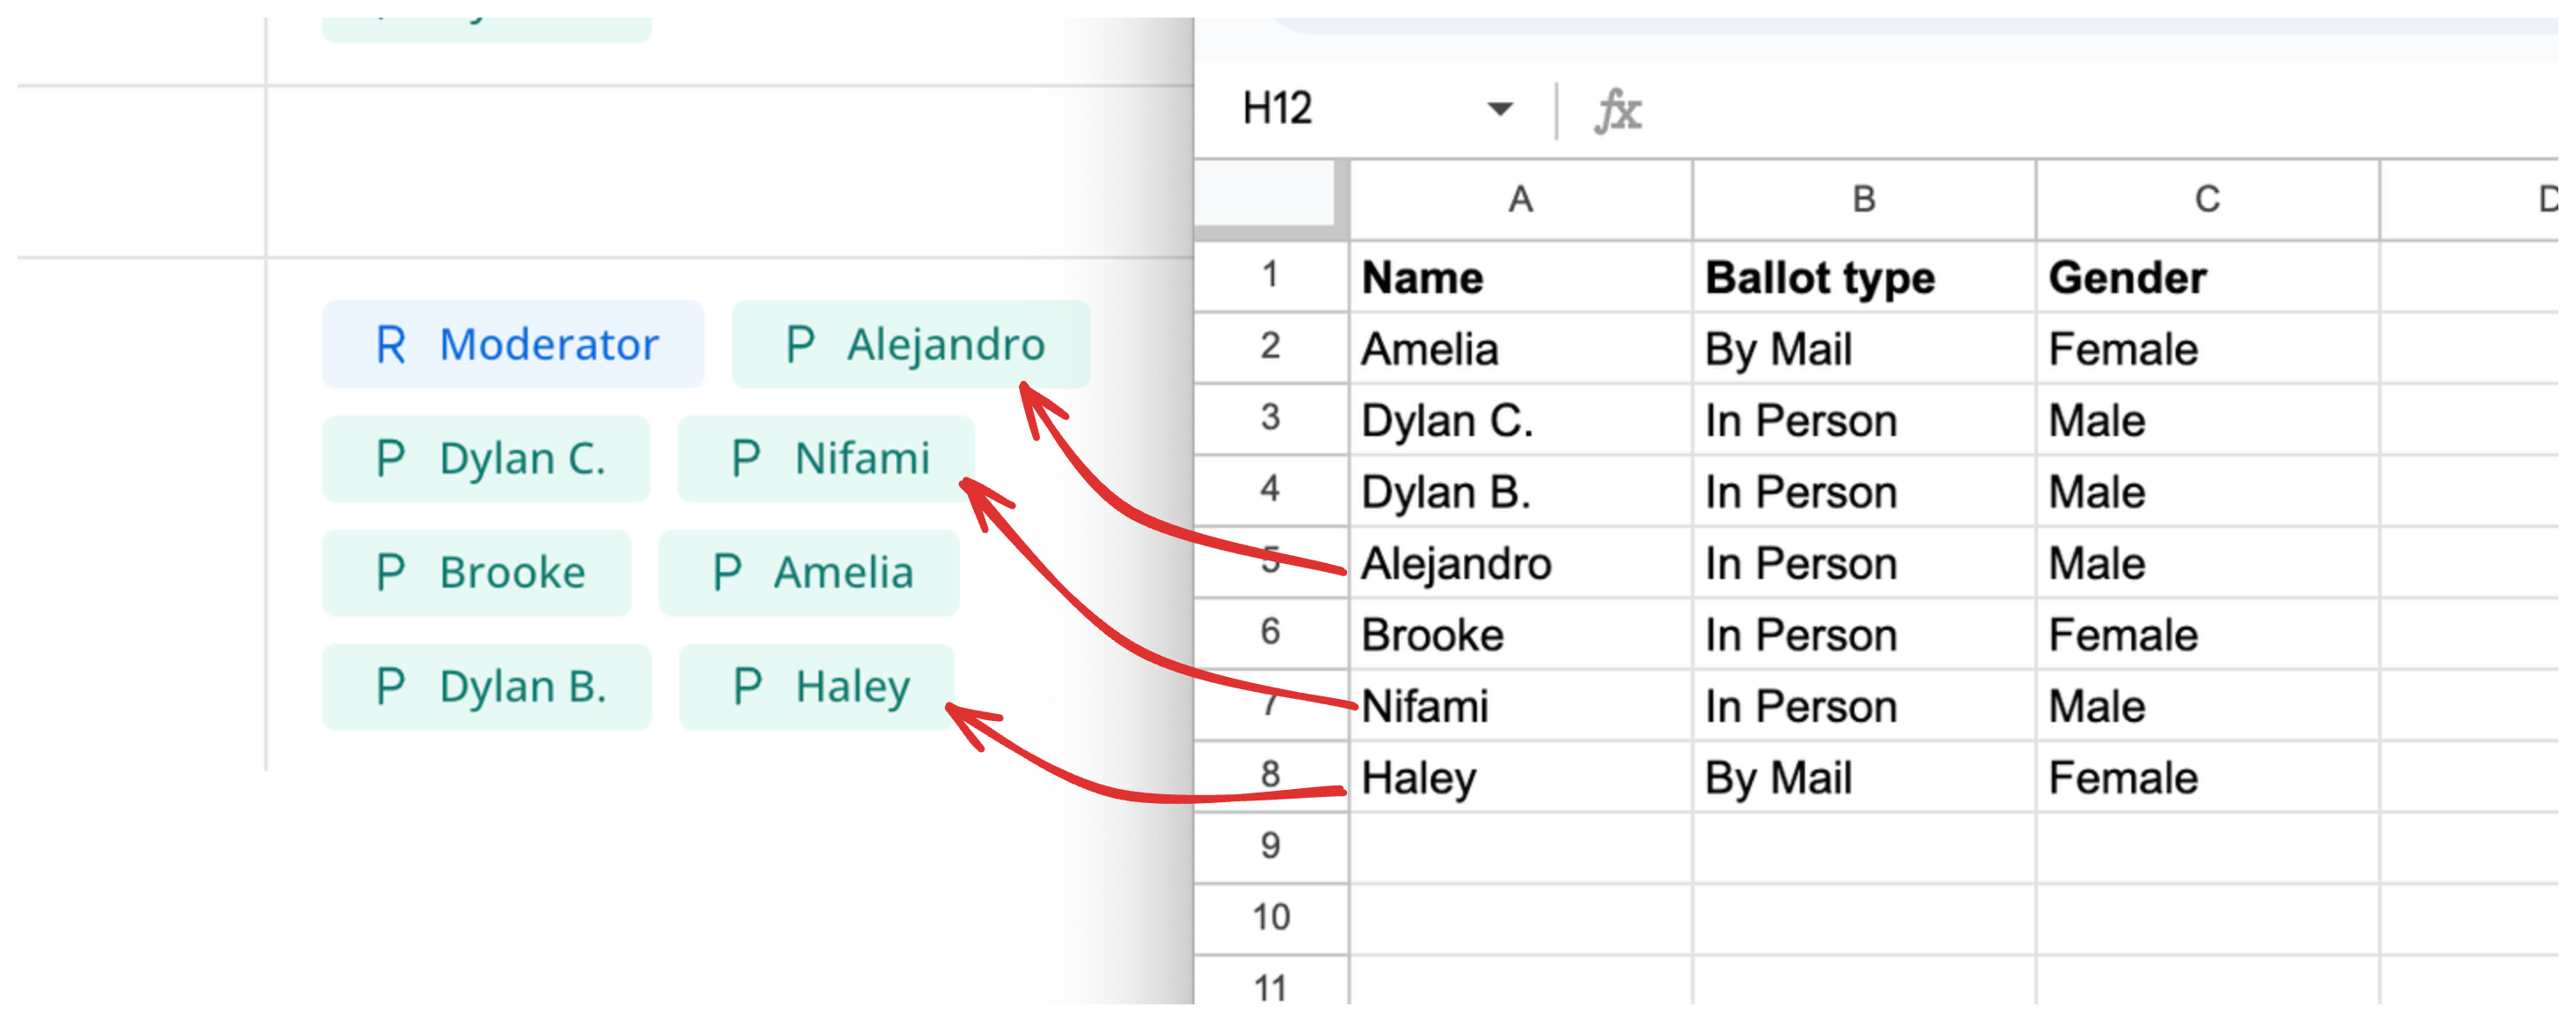
  • CoLoop matches participant names and populates segment data (e.g., gender, location, cohort).
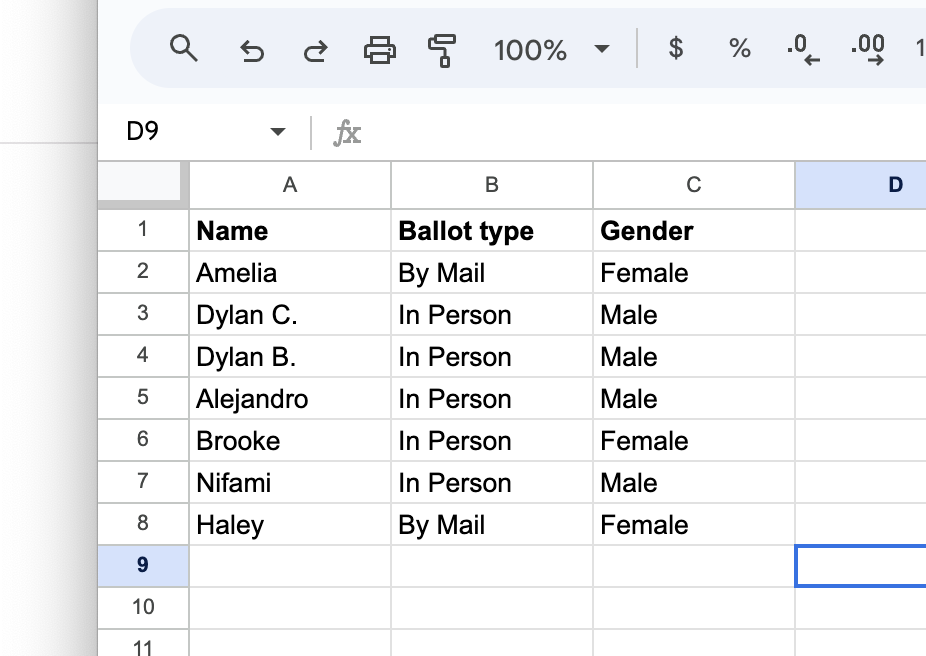
  • Ensure names in the Excel sheet exactly match those in CoLoop.
CoLoop allows you to build segments into your analysis grid. These are useful for:
  • Studies involving different demographics
  • Multiple markets

Create a segment

In order to create a segment got to the All Files page
  • Click Segments & Participants
  • Next to each participant click on the Add Segment button
  • Enter a new segment name and create it
  • or Select a segment from the dropdown list below
  • Click off the menu or hit enter to add your selection

Create multiple segments at once

In order to apply multiple segments at the same time you can upload an xlsx file or recruitment grid. Please this is a workaround that makes use of the community data feature to create and merge speakers with segments hence the references to “import community data” below.
  • Create a spreadsheet containing your segments…
Speaker names must match up exactly in the Excel file and in CoLoop!
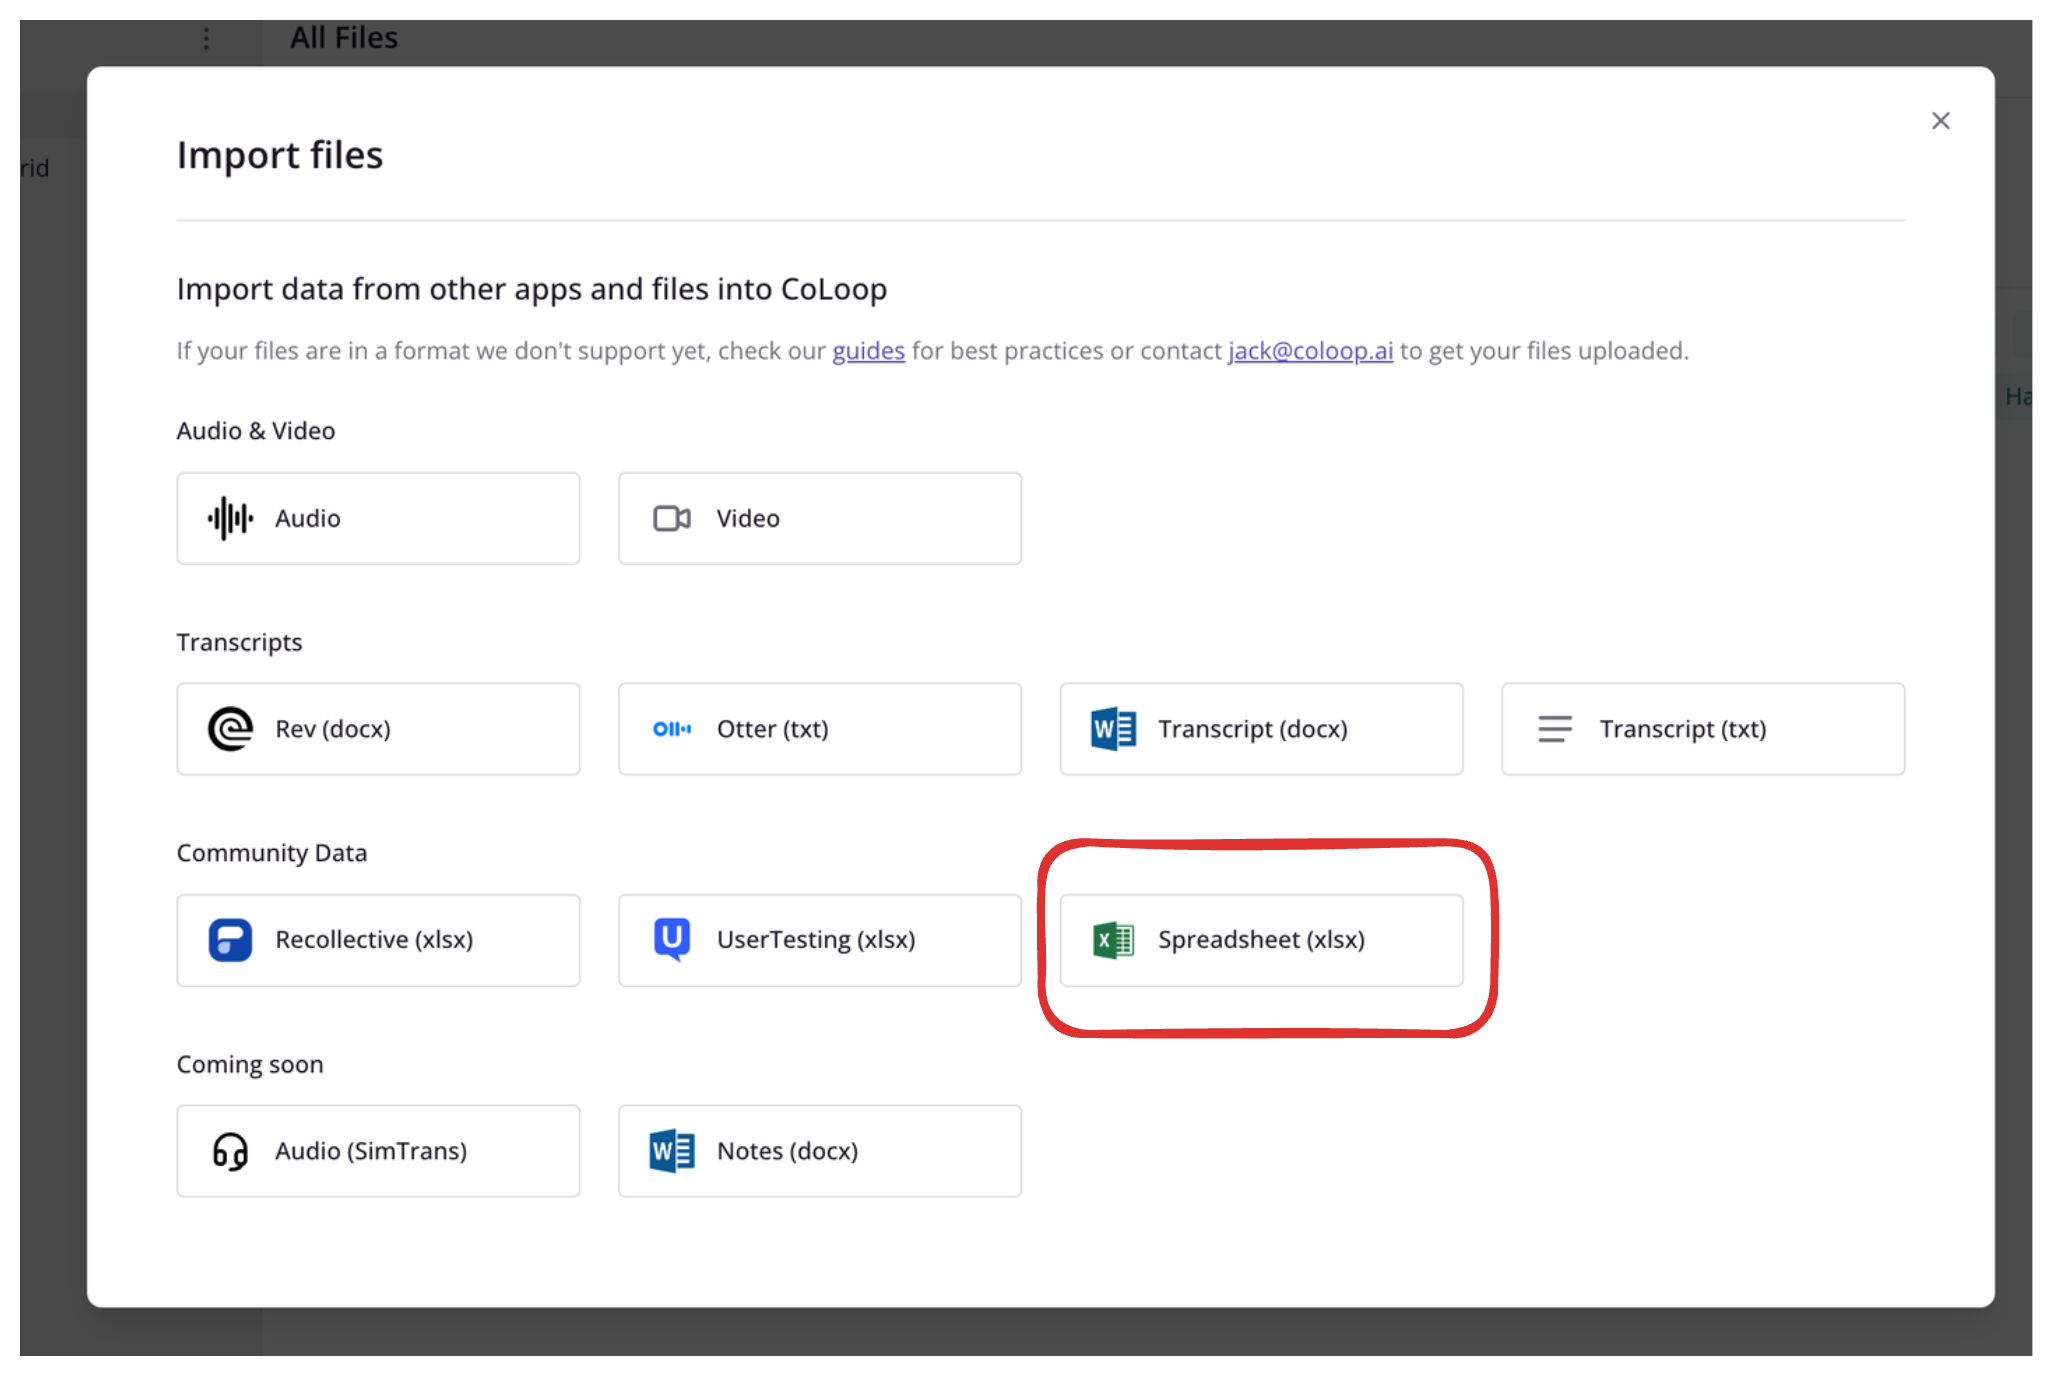
  • Click + Import Files
  • Select the Excel option
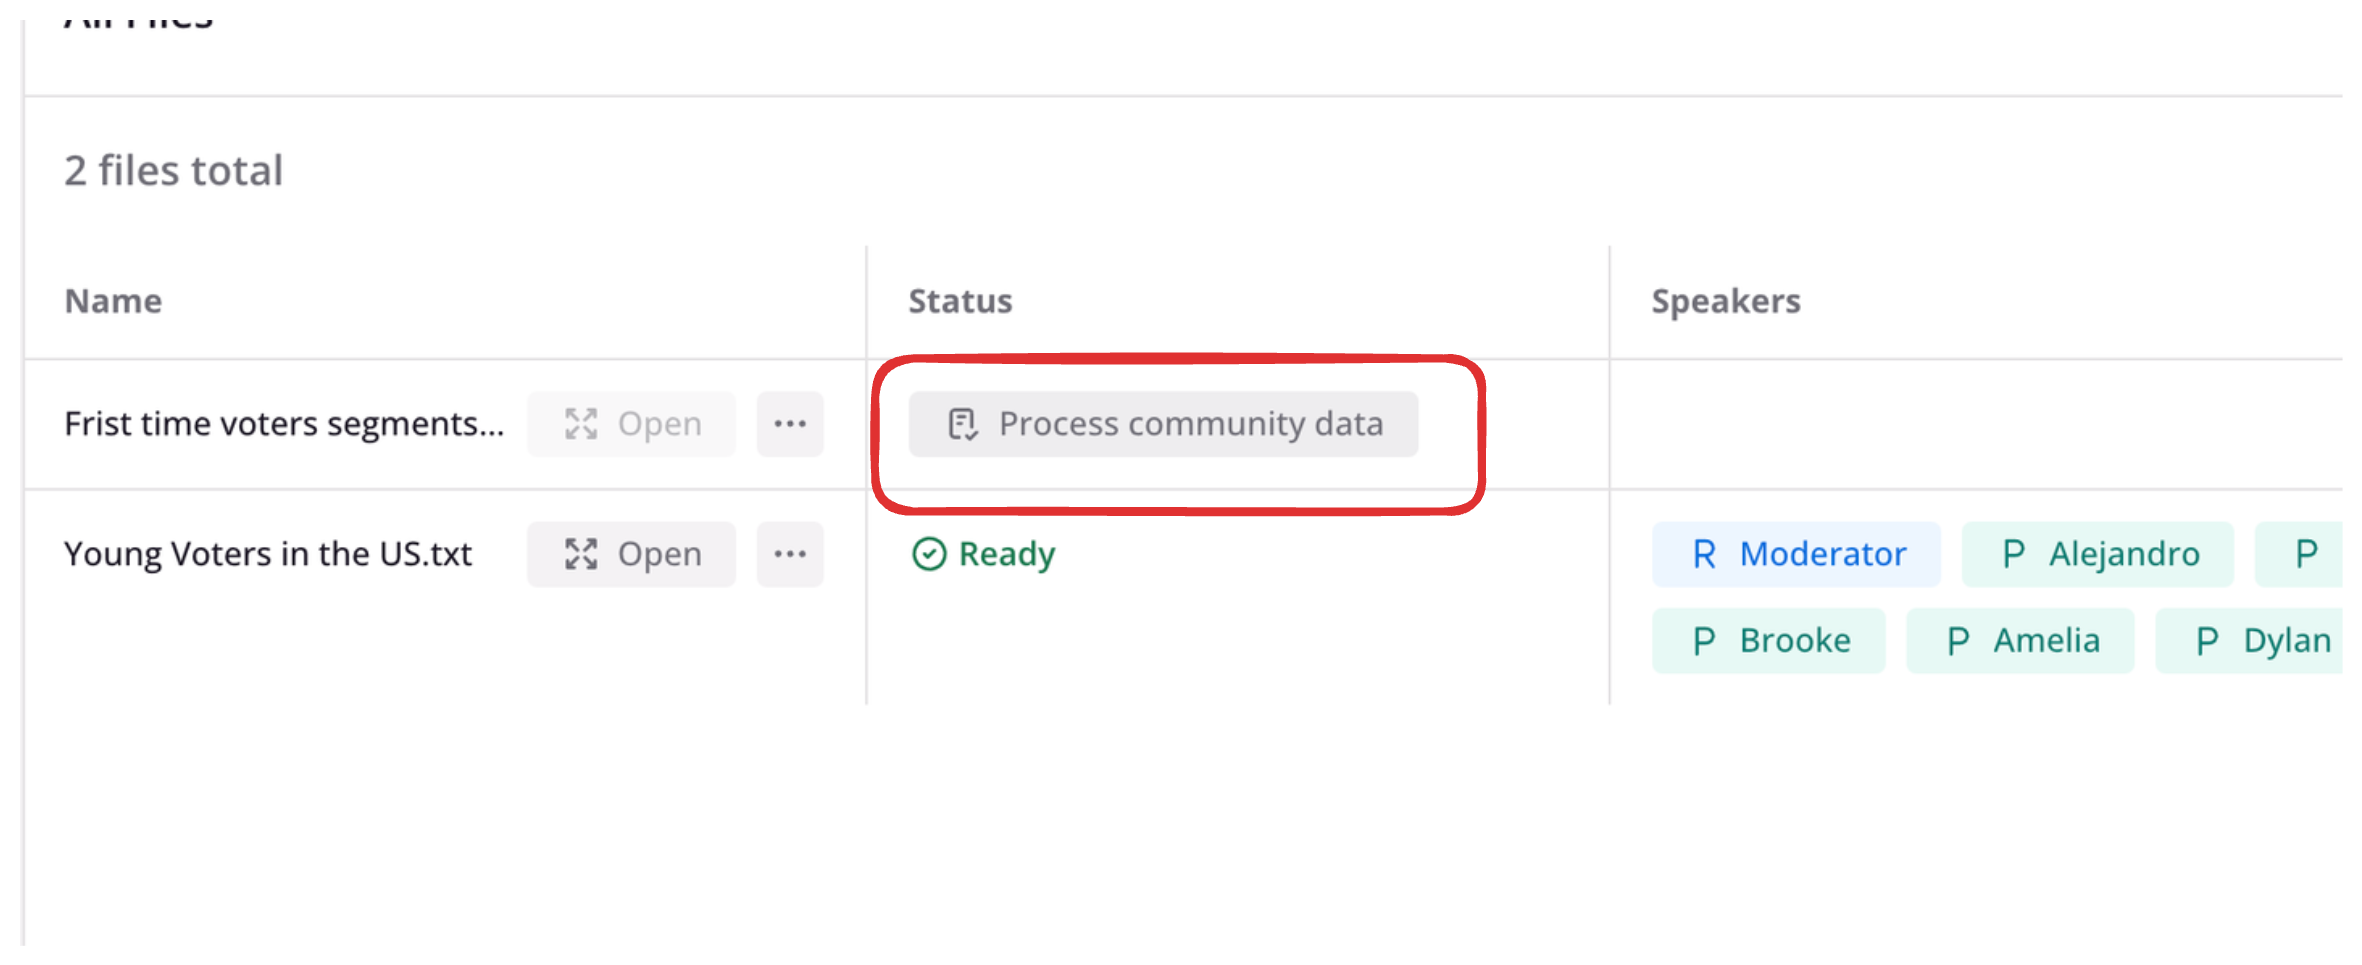
  • Click ‘Process Commnunity Data’
  • Click the “Segment” tick box for any columns that correspond to a segment
  • Click “Import community data”

Using segments in the analysis grid

You can generate a summary for a specific segment by using filters in the analysis grid. When creating a comparative grid, you’ll also be able to use segment data to analyze cross-sections of your data.
  • Click + Add filter
  • Tick the segment you’d like to apply
  • Close the menu to apply them

Using segments in the AI chat

You can filter on segments in the AI chat to limit answers to a subset of users.
  • Press ”@ Segment”
  • Or simply type an @
  • Select an participant or segment from the list
I