Analysis & Output - Explore your Data
Explore your data by either creating insights, using the grid view, or take your analysis offline by exporting the data. You can also check the final version of your codebook at anytime, and remind yourself what each theme, sub-theme and code means.Insights
Visual your data using insights. Created insights focusing on specific questions, segments, tags and sentiments using the filter function.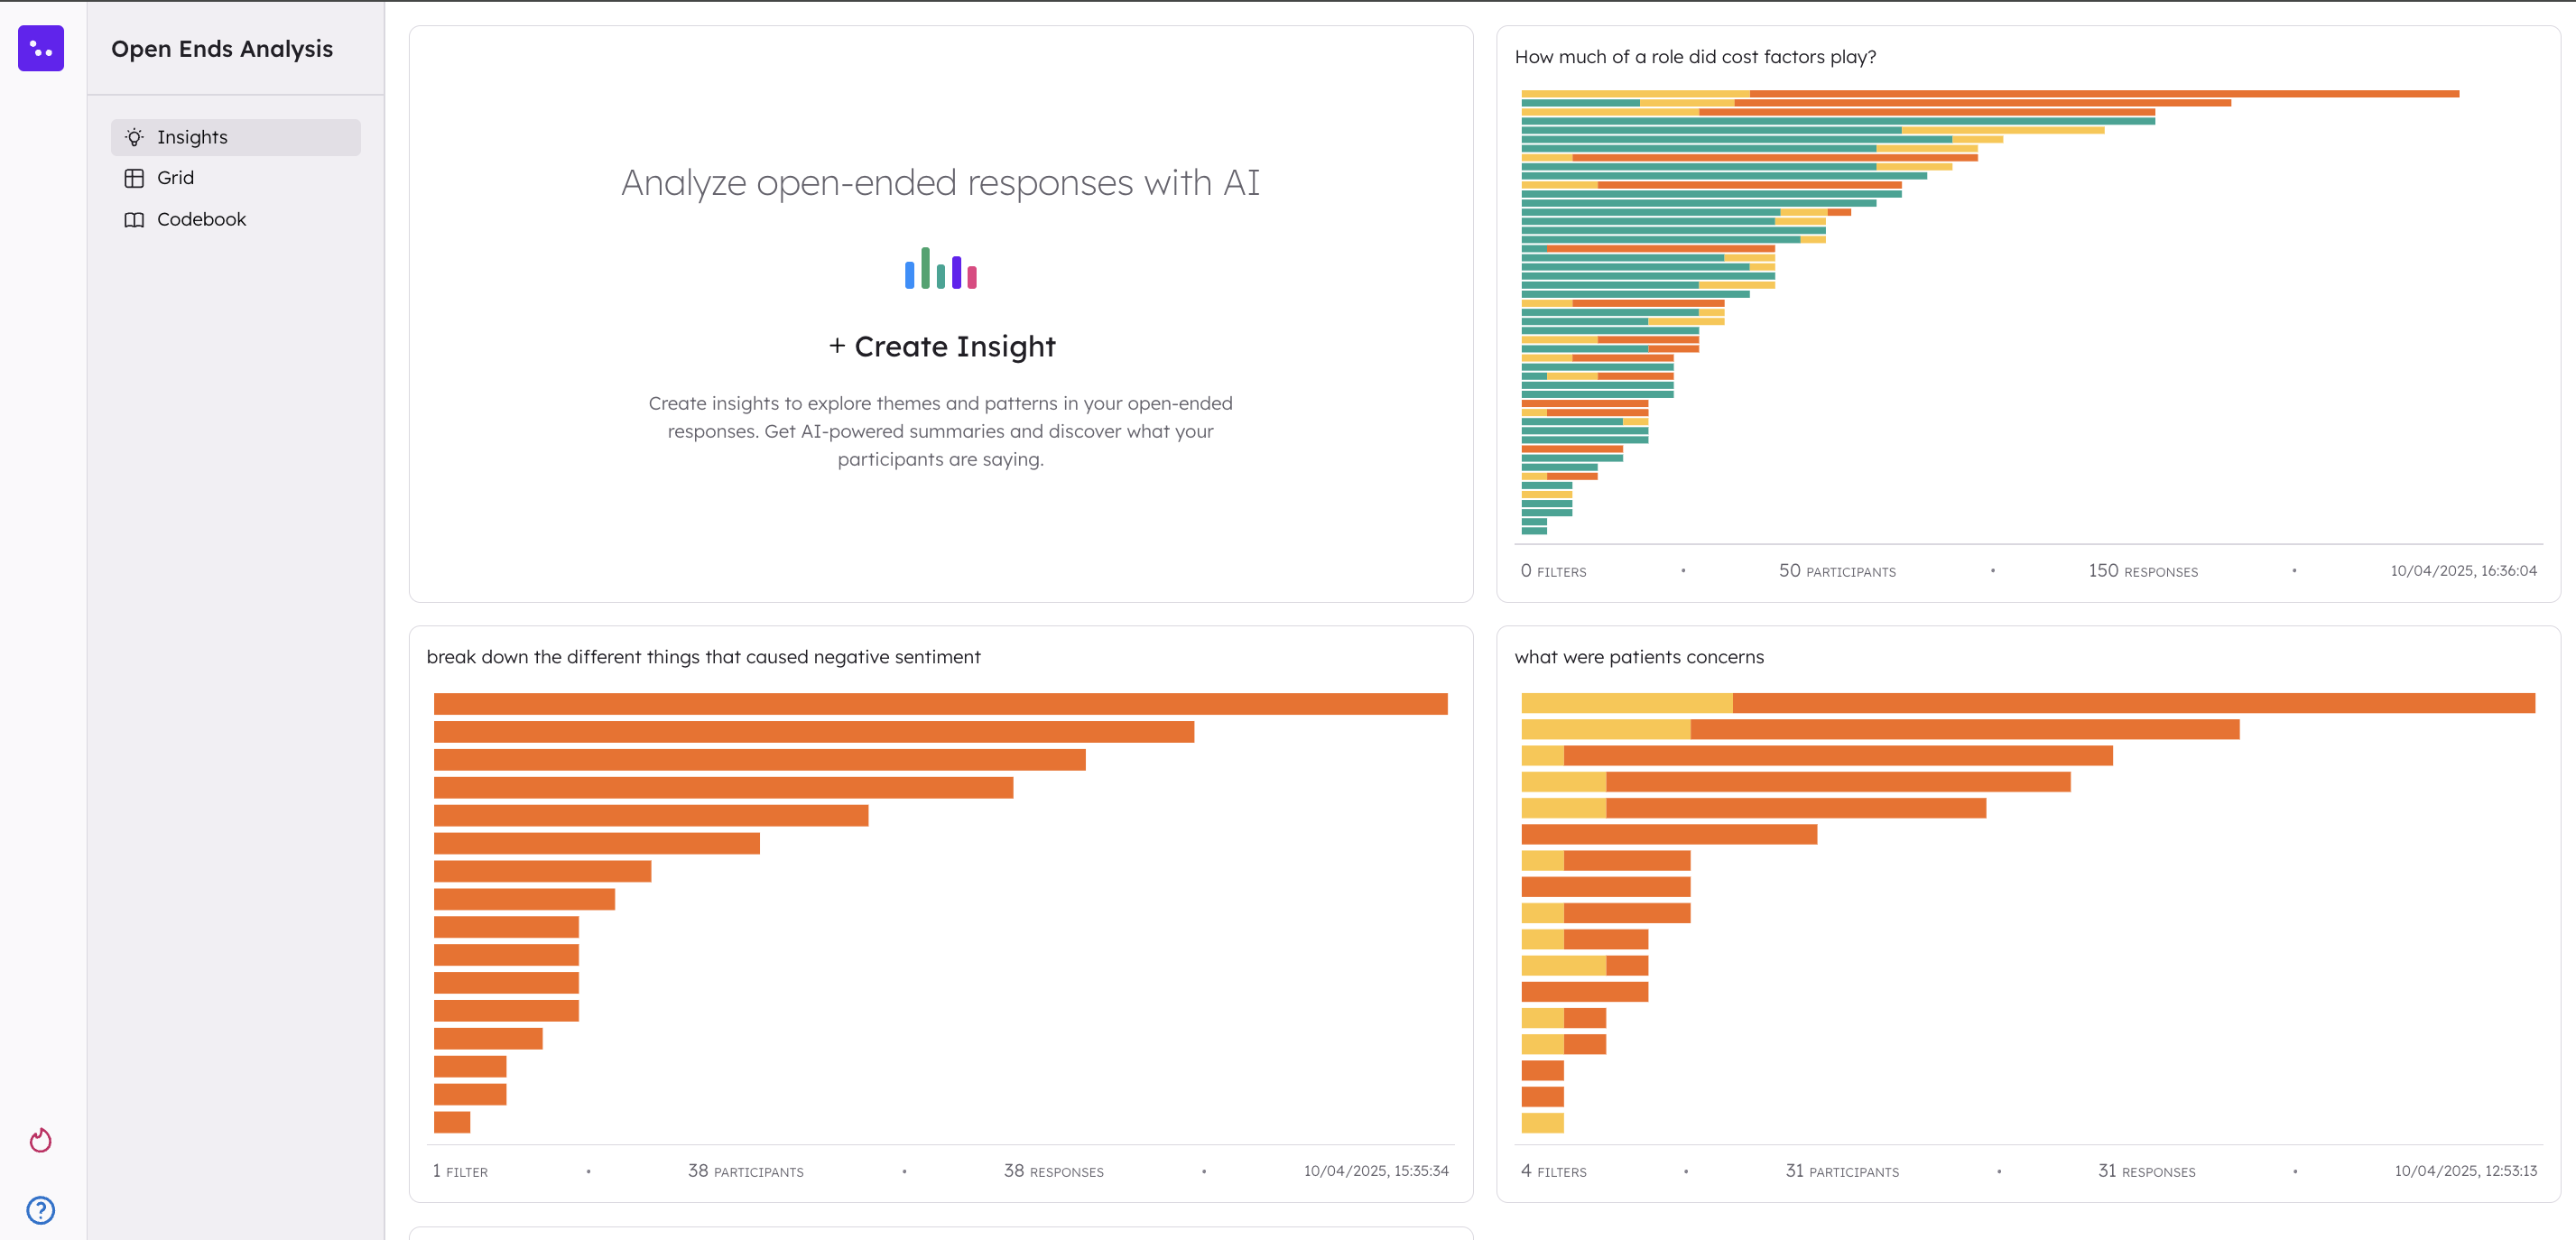 Additionally, you can query the data and ask CoLoop questions about the data.
Grids
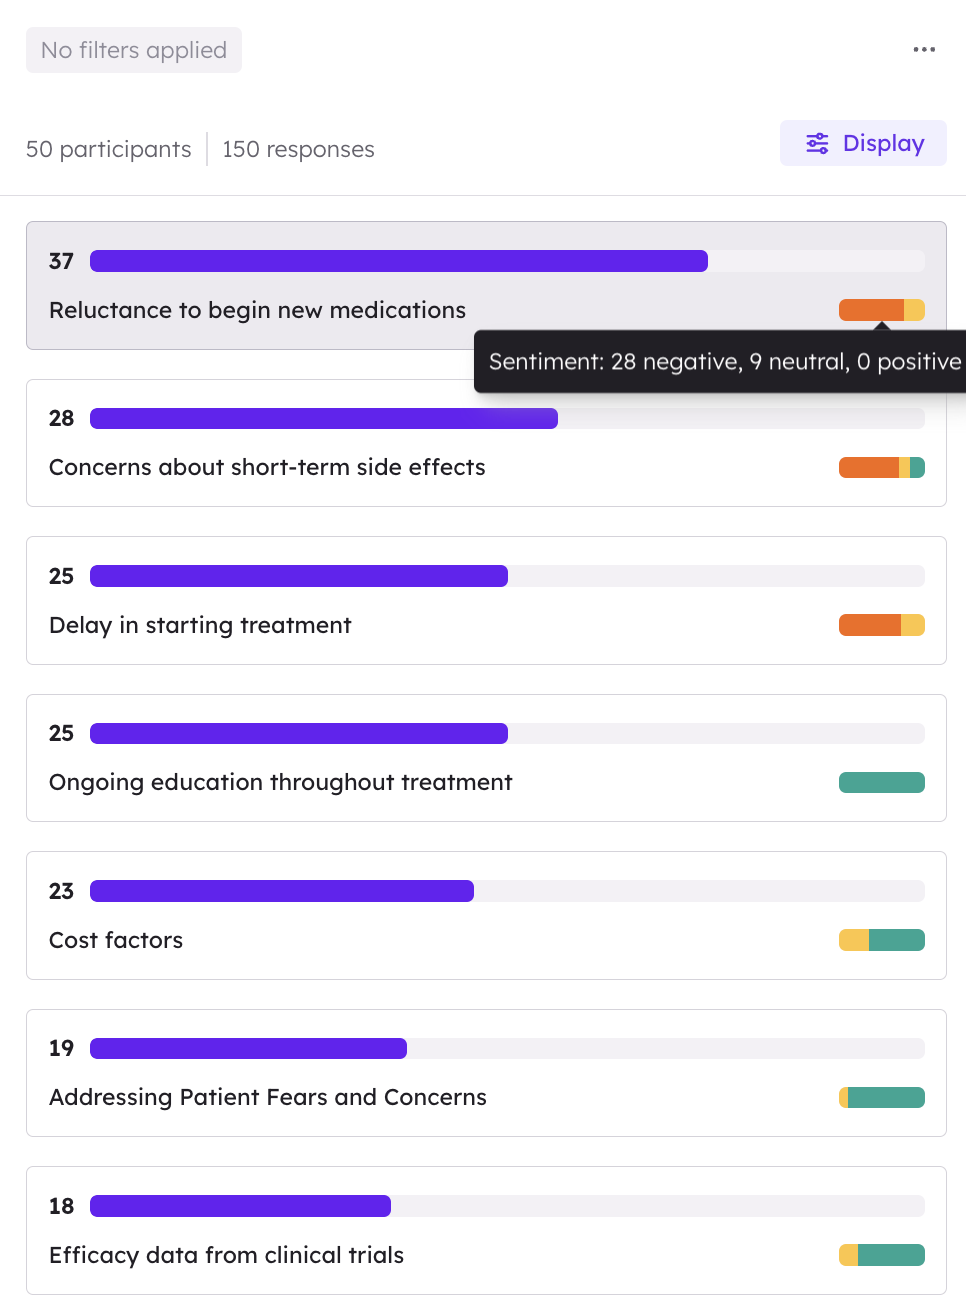
Analyse and explore your data using the grid view. CoLoop will display all codes in descending order based on the number of open-ended responses assigned to each one. If sentiment analysis was applied, this will be shown at the bottom right of each theme. To view the sentiment count, users can hover over the sentiment bar with their mouse.
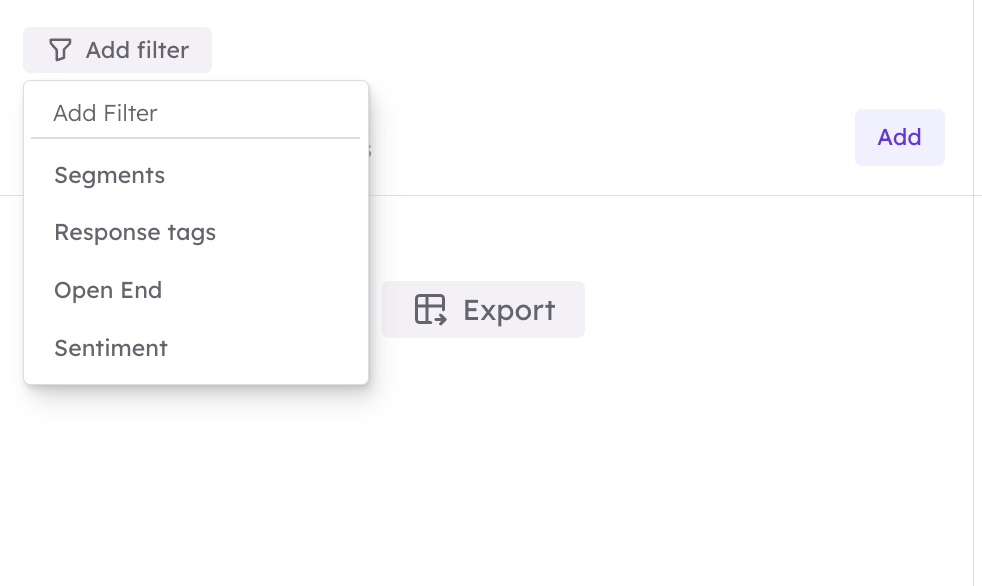
 Users can choose to customise how they view their data by selecting a filter as shown below. You can add multiple filters.
 CoLoop will output a column for each sets of filters applied. Shown below, from left to right below, are analysis columns showing a participant segment filter, a sentiment filter and a specific question filter. Users can choose to display response numbers in either raw count or by percentage, as shown on the right hand side of the image below.
Evidence Panels
To inspect evidence, users can click on a theme which will prompt an evidence panel to open up on the right hand side of the screen, as shown below.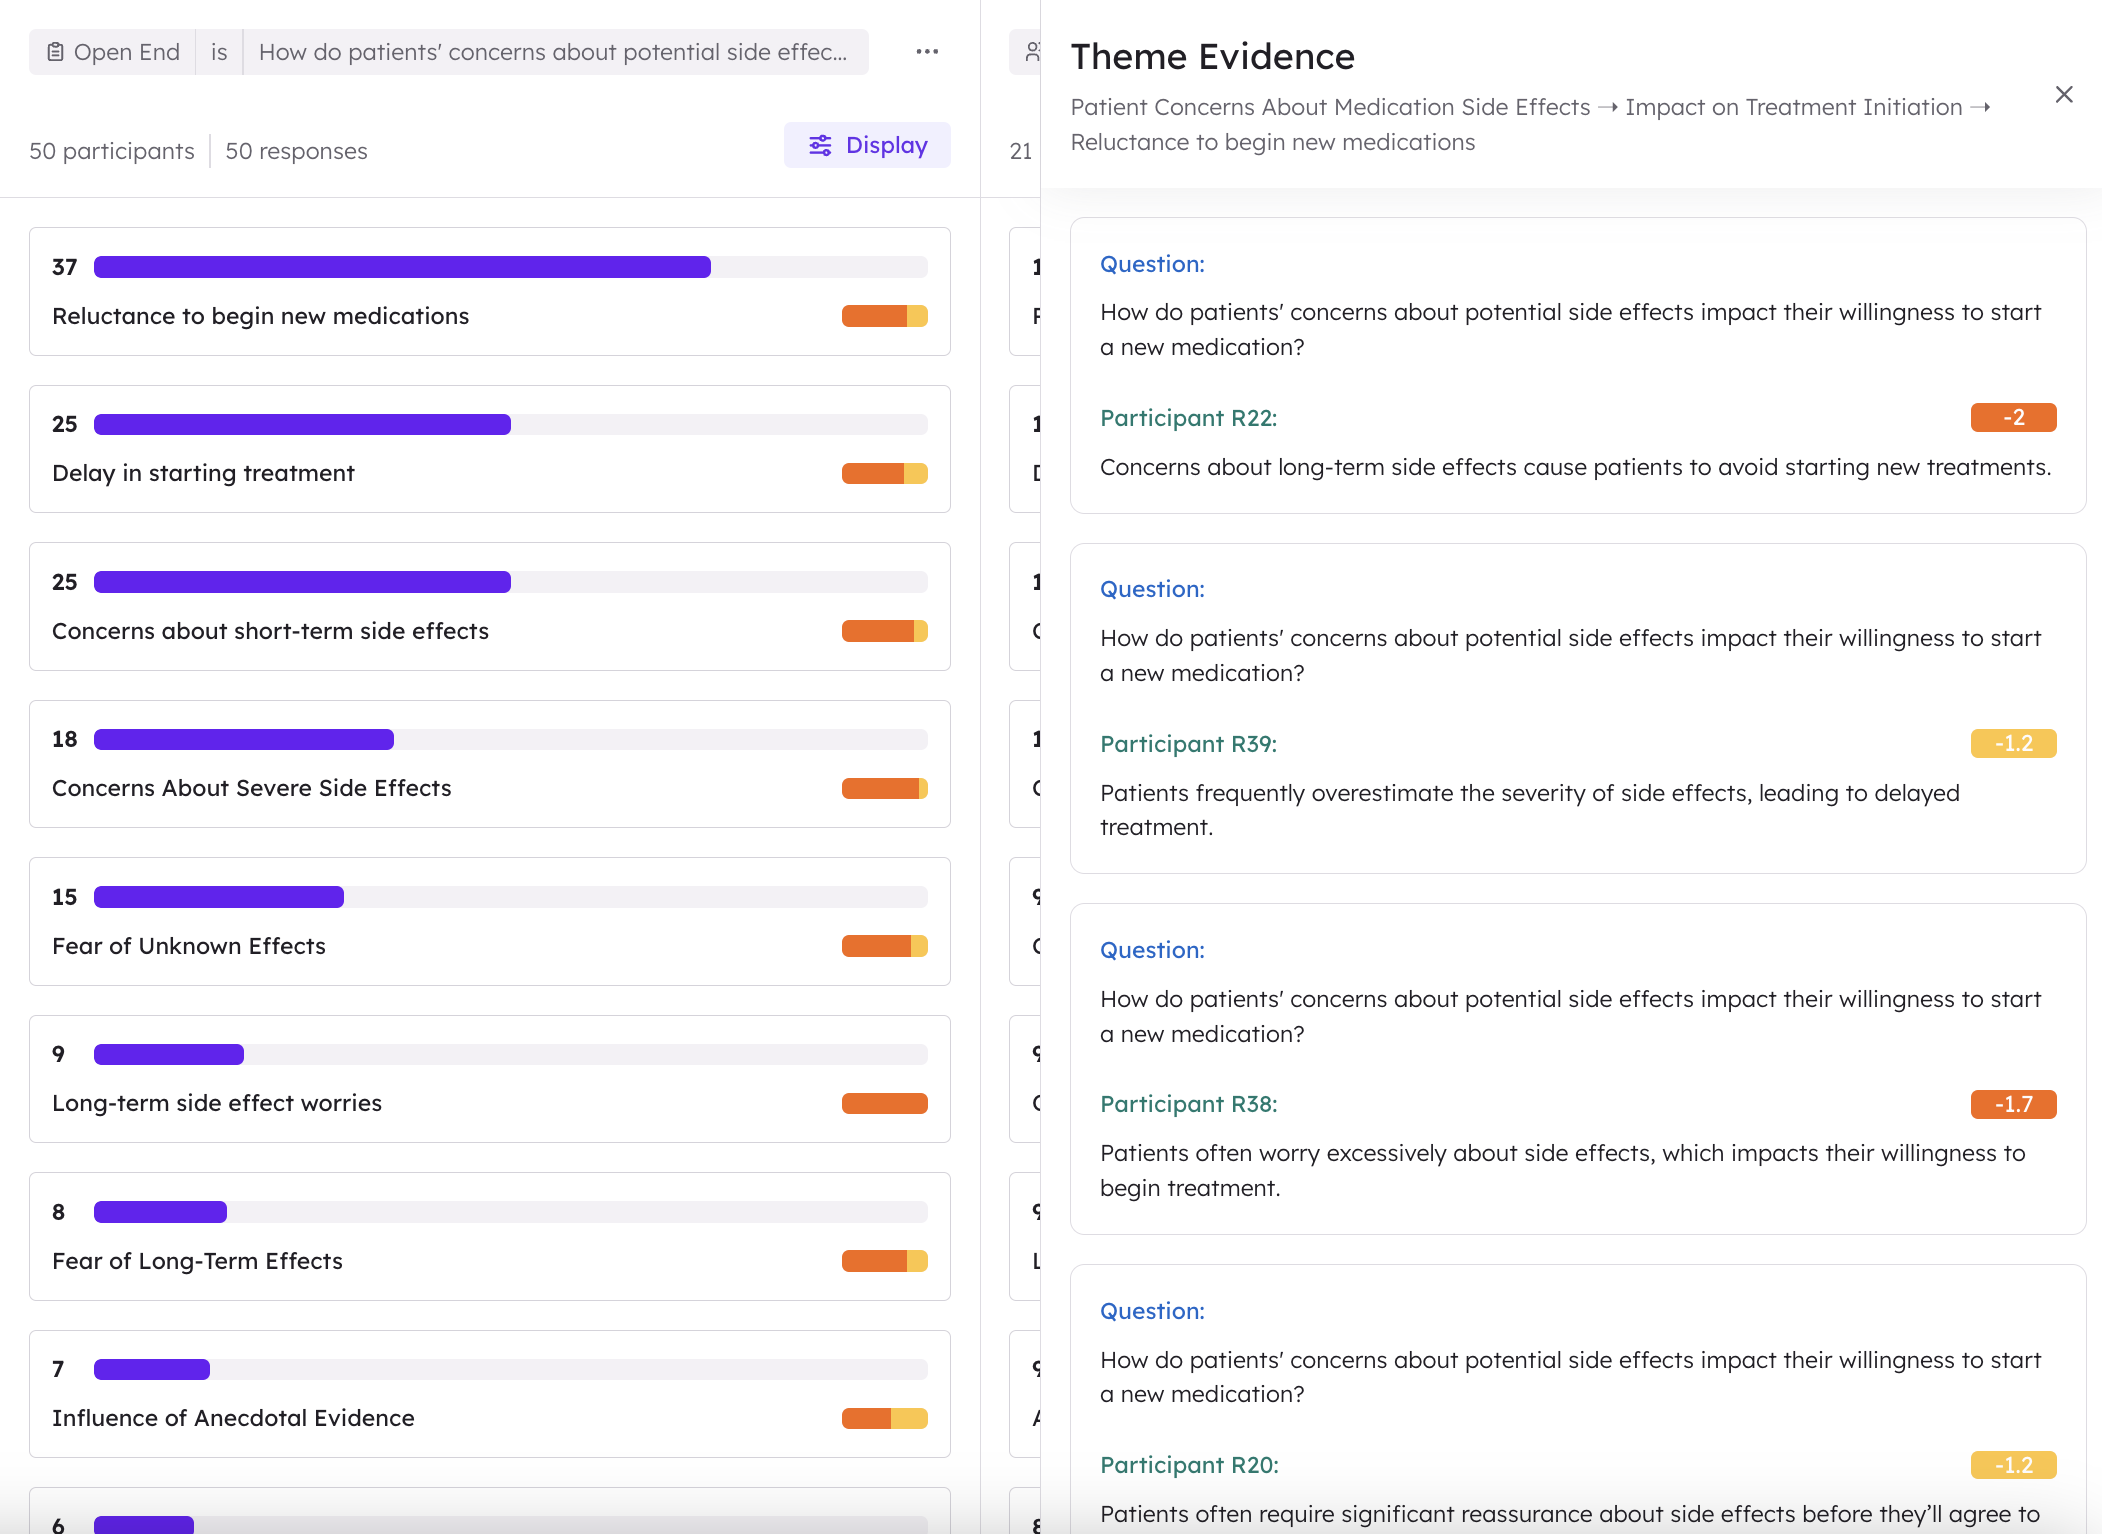
Exporting Open Ends Analysis
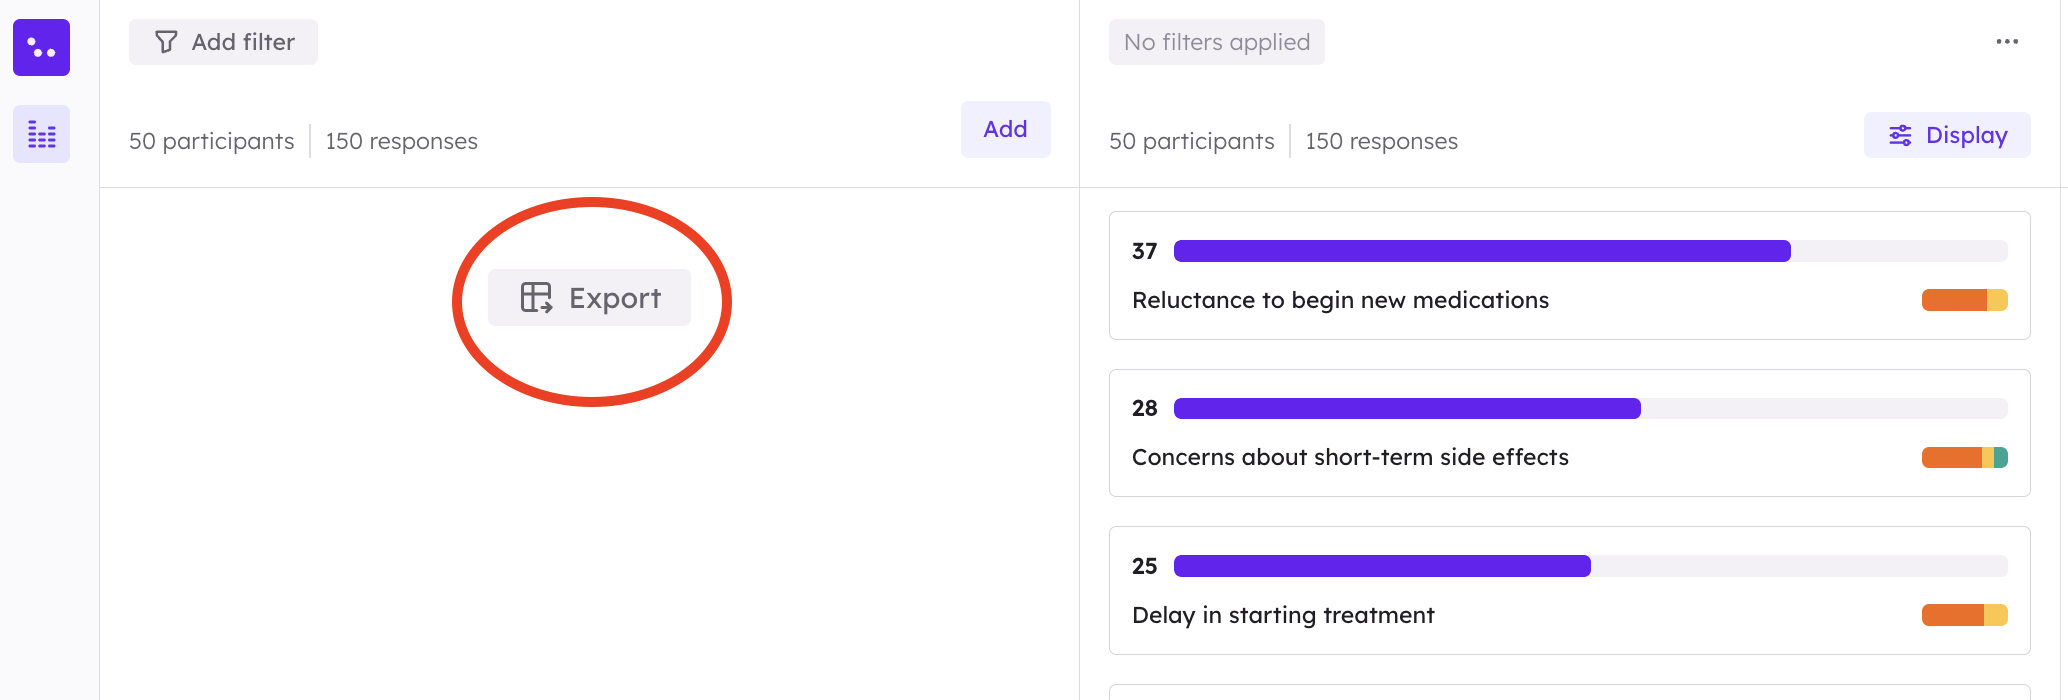
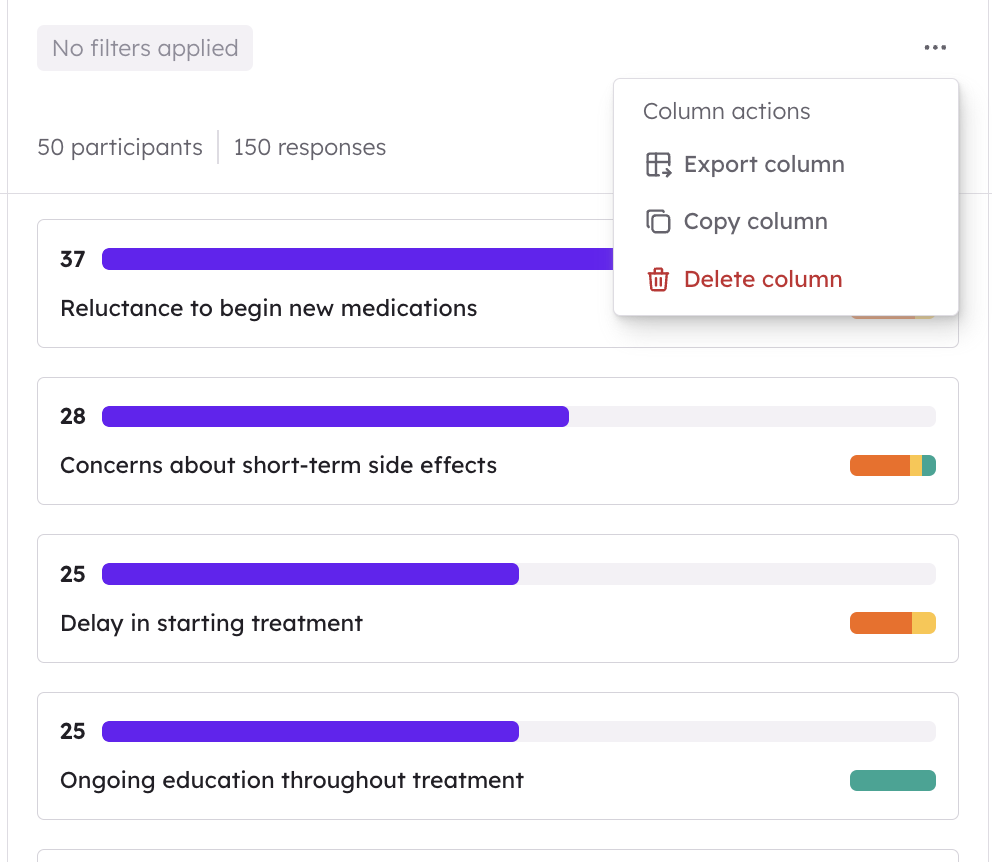
Users can easily export their open ends analysis to xlsx. format. Users can export the whole grid, by selecting the export button found on the left of the analysis dashboard, as shown below.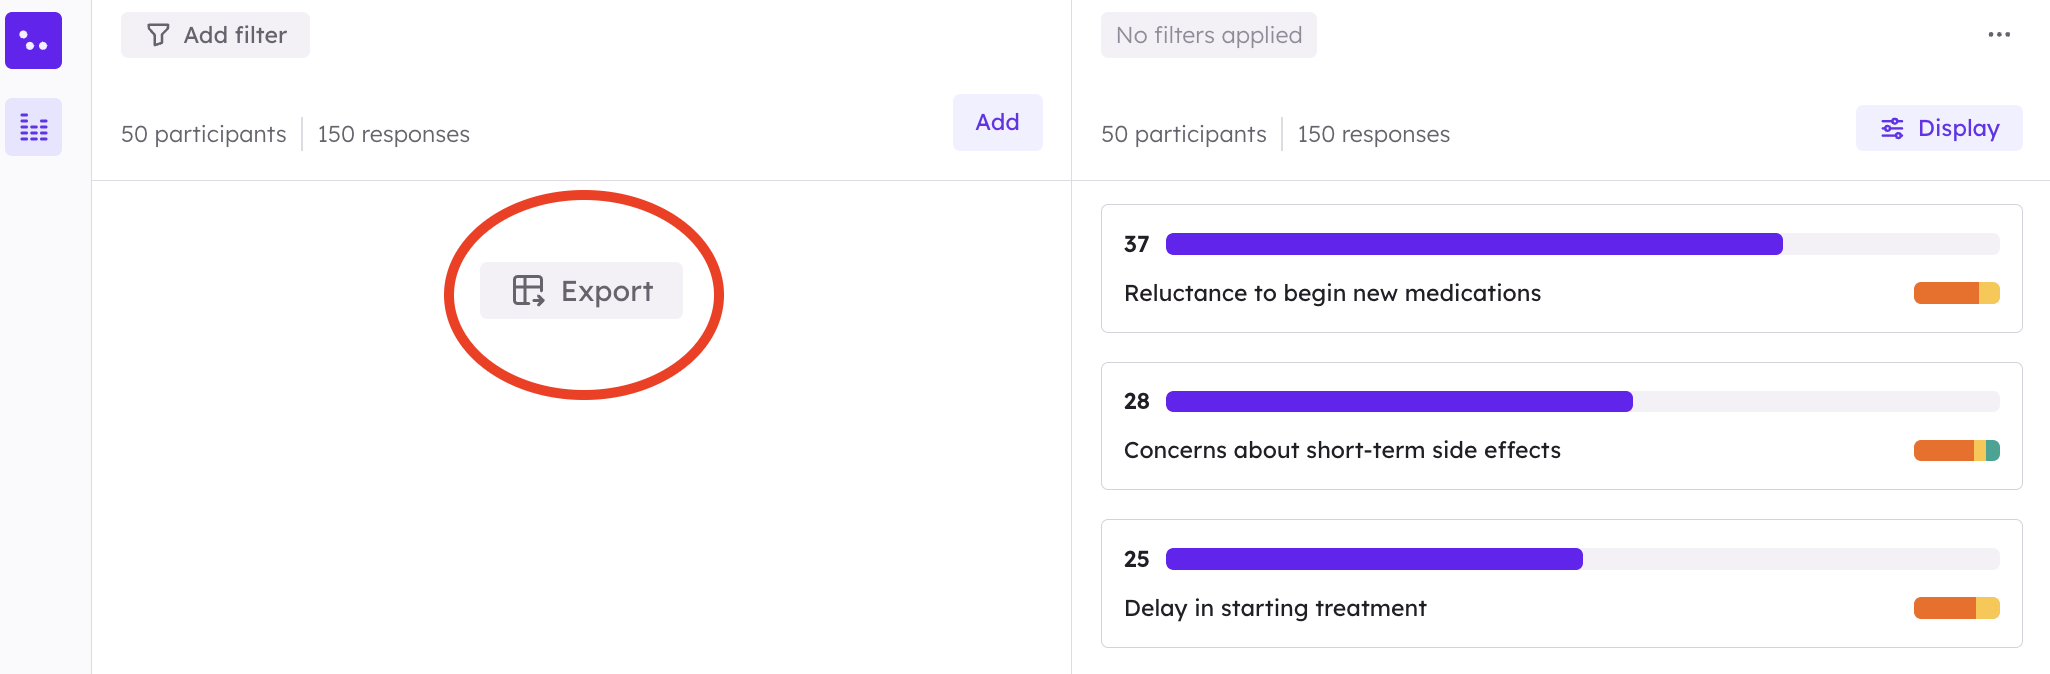 Alternatively, users can export individuals columns by clicking on the three dots at the top of each column as shown below.
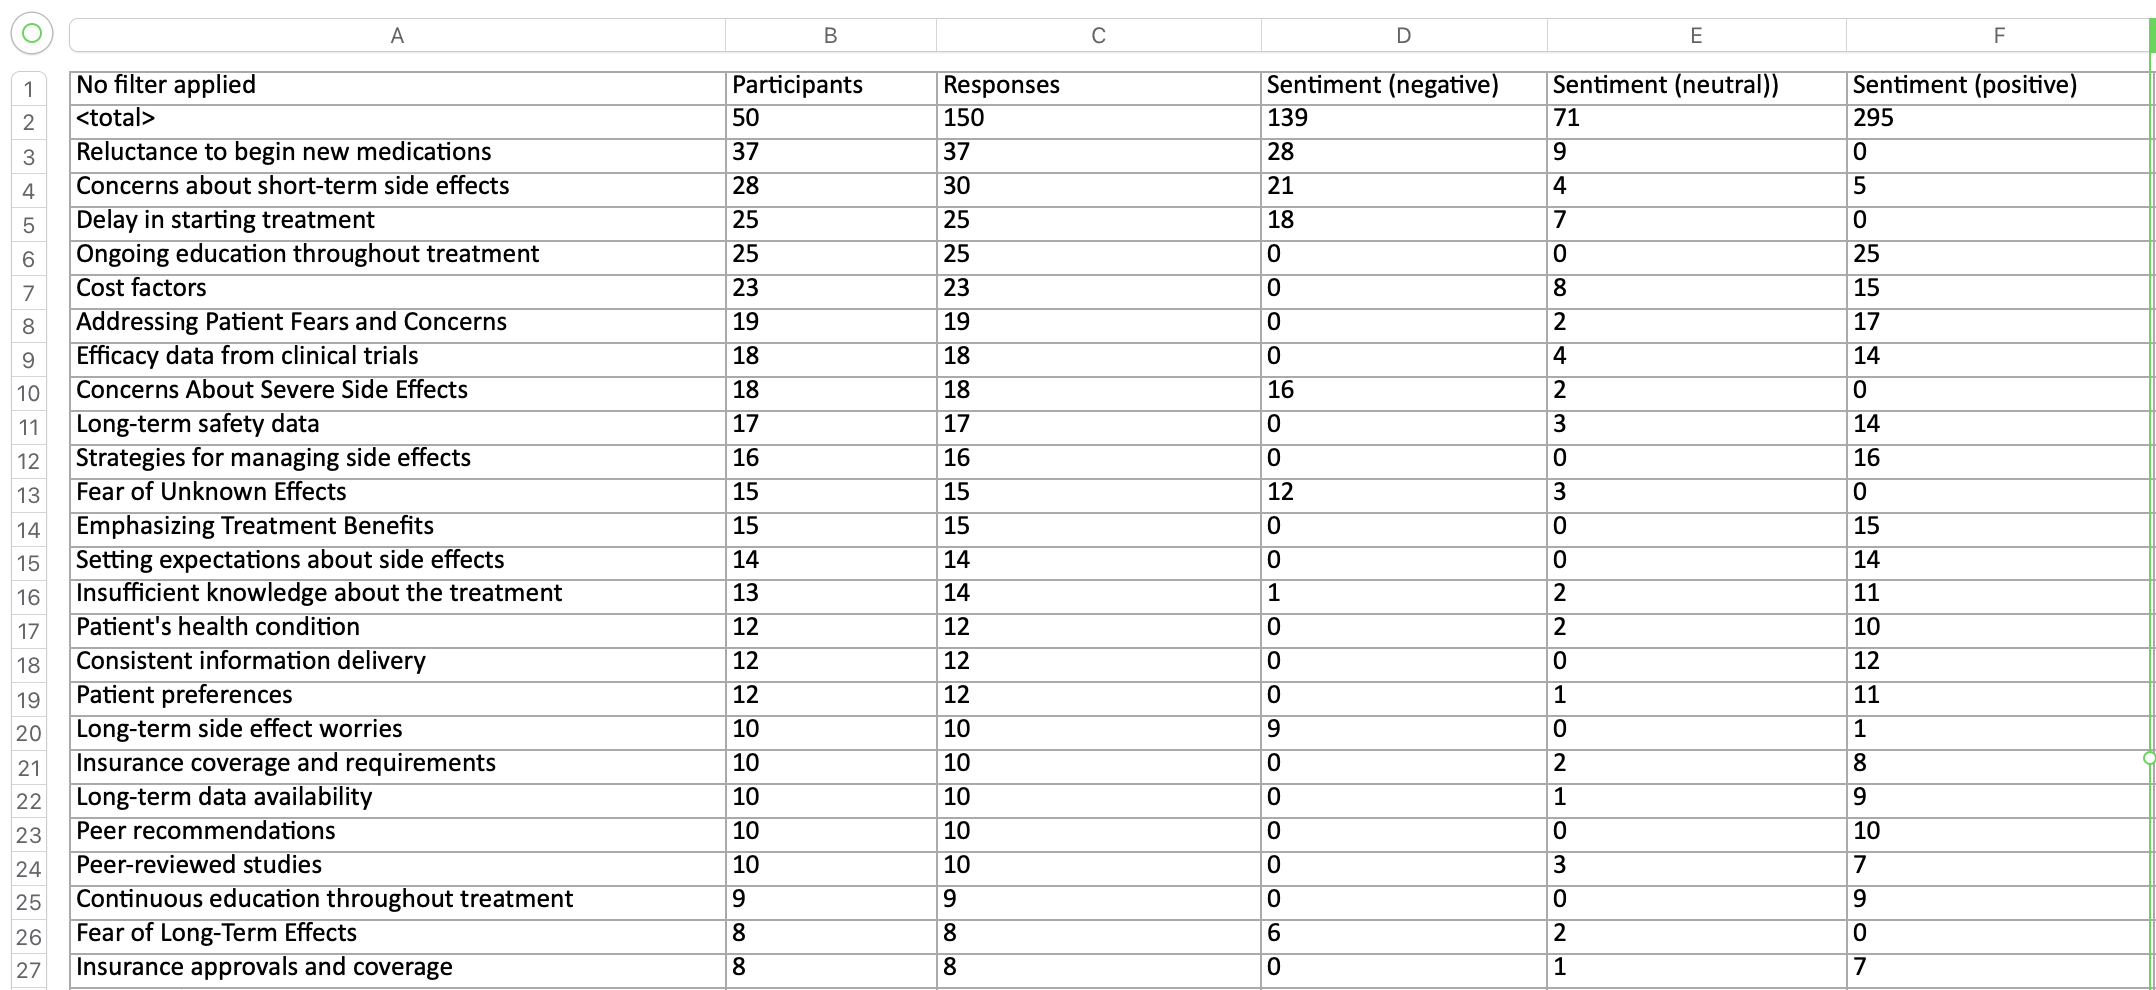
 Users can export the whole grid to Excel format by selecting “Export” and then “Grid”, as shown below. This output will produce an excel document which will list out all of the themes along with number of associated participants, responses and sentiment.
 Alternatively, users can export the raw data to excel files, in several formats.
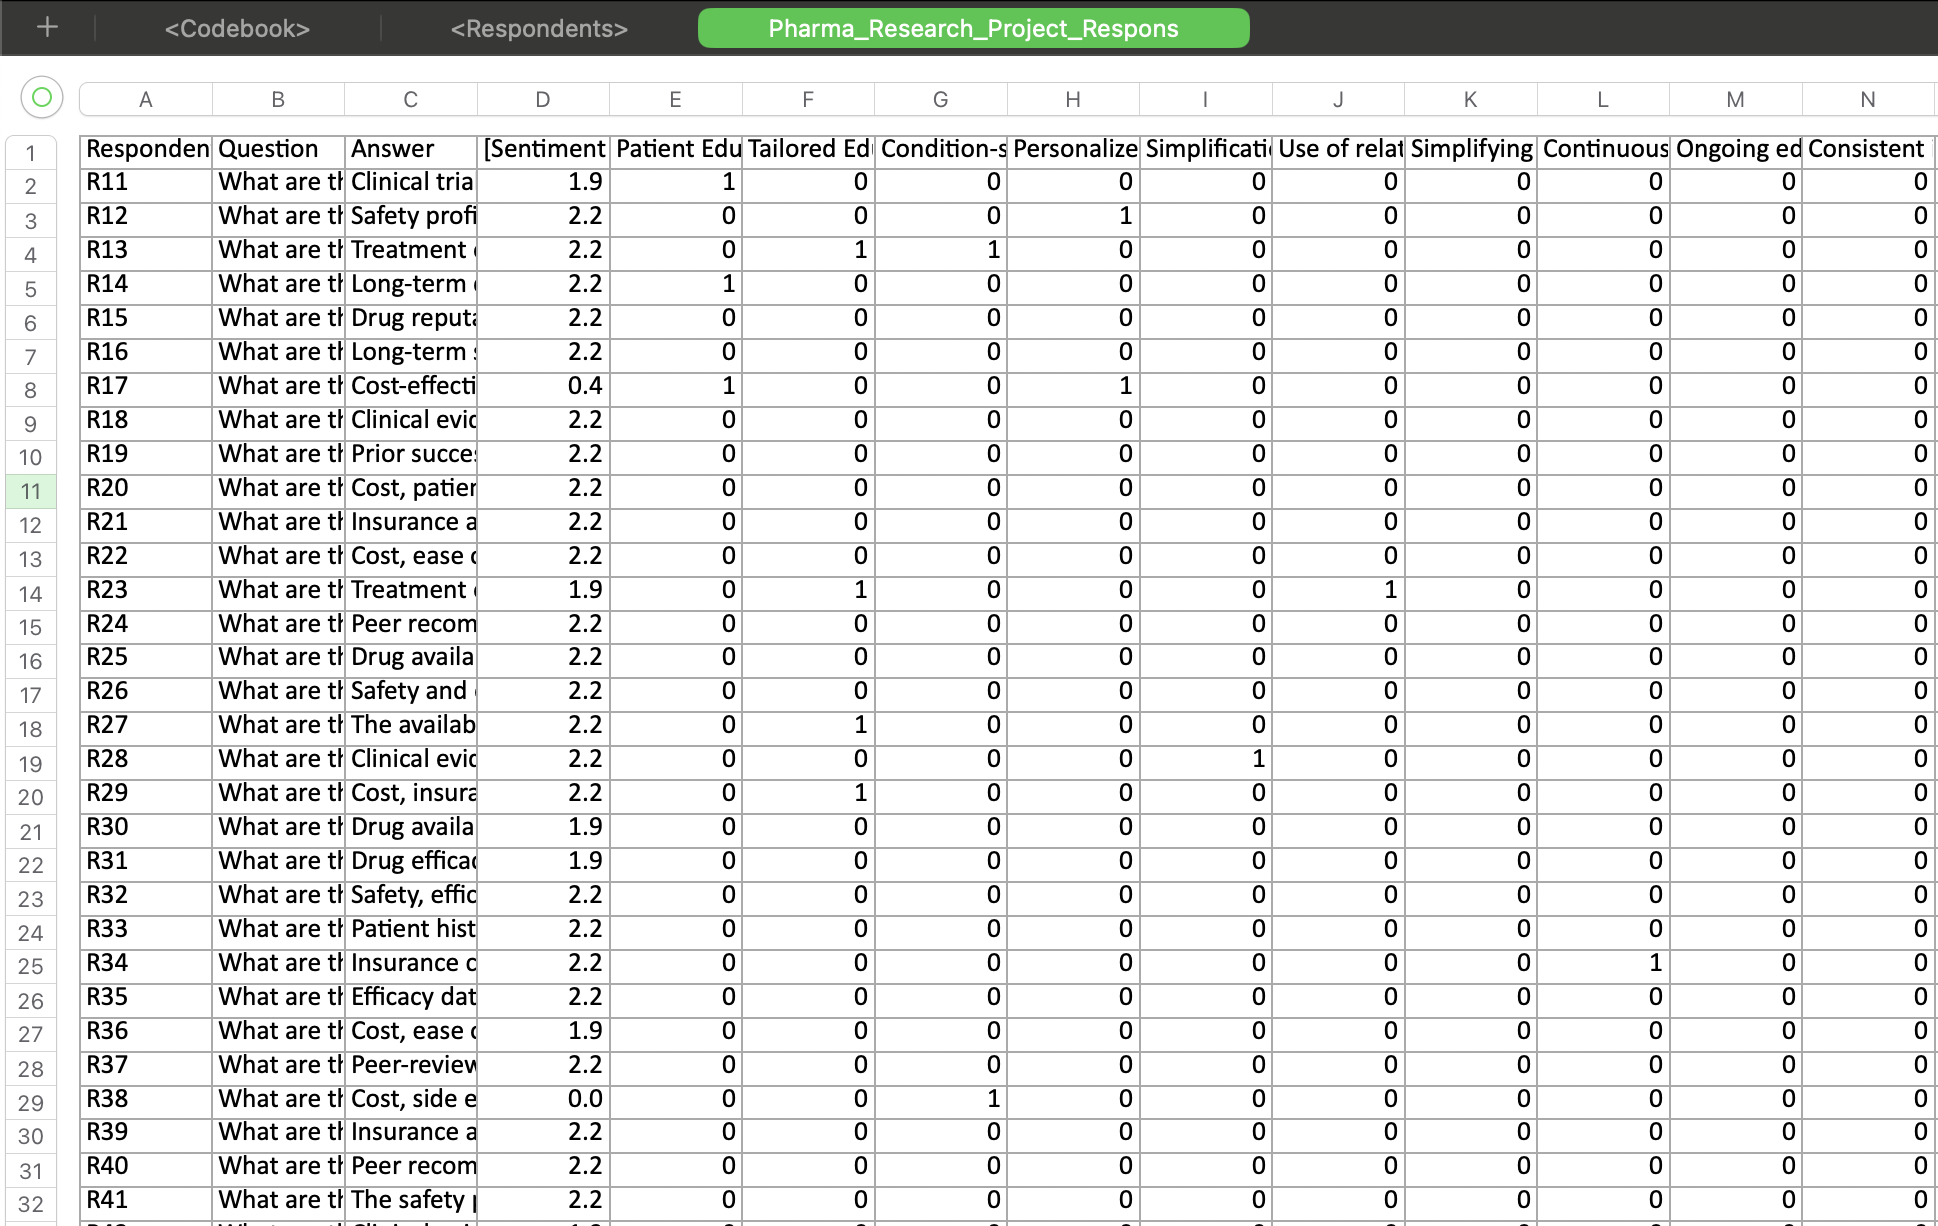
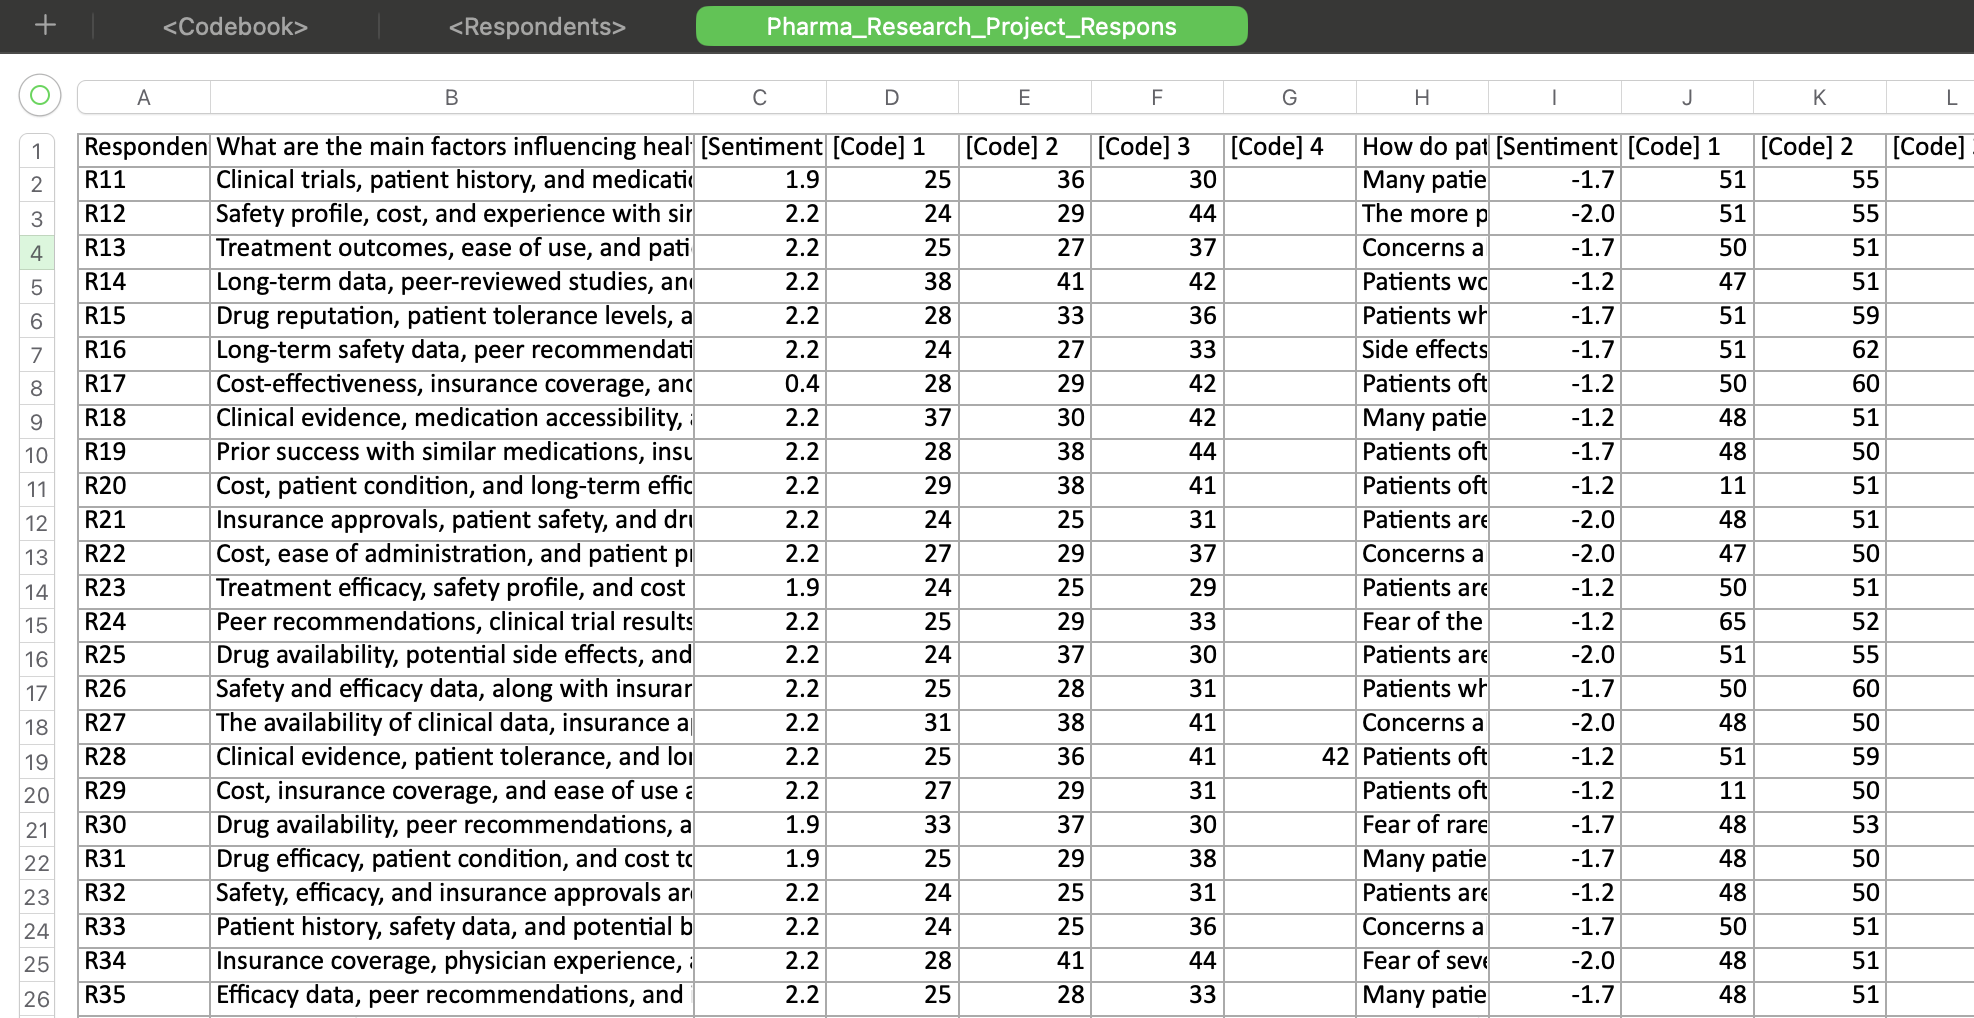
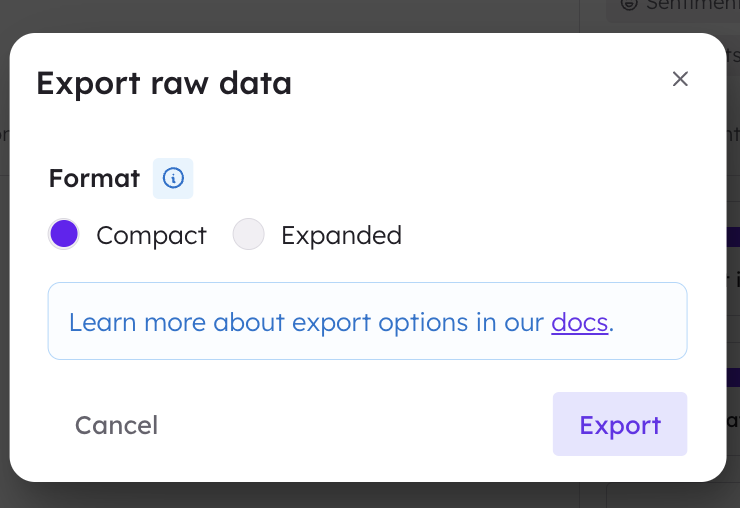 The compact export option will provide users with an Excel sheet with three tabs, the first with the codebook, the second with a respondents list, and the third with each respondent’s open ended responses and their associated codes and sentiments, as shown below.
 Alternatively, the Expanded export option will provide users with a more granualr breakdown which can be be easily used in further data analysis.
 Expanded export options explained:
- Expanded Only: Will produce an output that contains a code-by-code breakdown of how each open-ended response was coded in a binary format; 1 indicating the presence of a code for that response, and 0 indicating its absence.
- One row per conversation: All conversation turns for the same participants will be in the same row with an averaged (mean) sentiment and aggregated codes. (Only applicable to ChatBot data).
- Include “Uncoded” theme: This will add an uncoded theme at the end of the excel file which indicates which open ends have no associated codes.