- Basic analysis grids contain all of your participants
- Each row corresponds to an individual speaker
- They can be scoped to look at all the participants, IDI & Focus Group Participants or Participants from OBB / Communities like Recollective
- They are limited to a maximum of 200 participants
- They show a count next every theme corresponding to the number of participants the theme applies to
Creating a basic analysis grid
To create a basic analysis grid click on one of the first 3 options (All, IDIs/focus groups or Community data). This will create an analysis grid scoped to that set of data.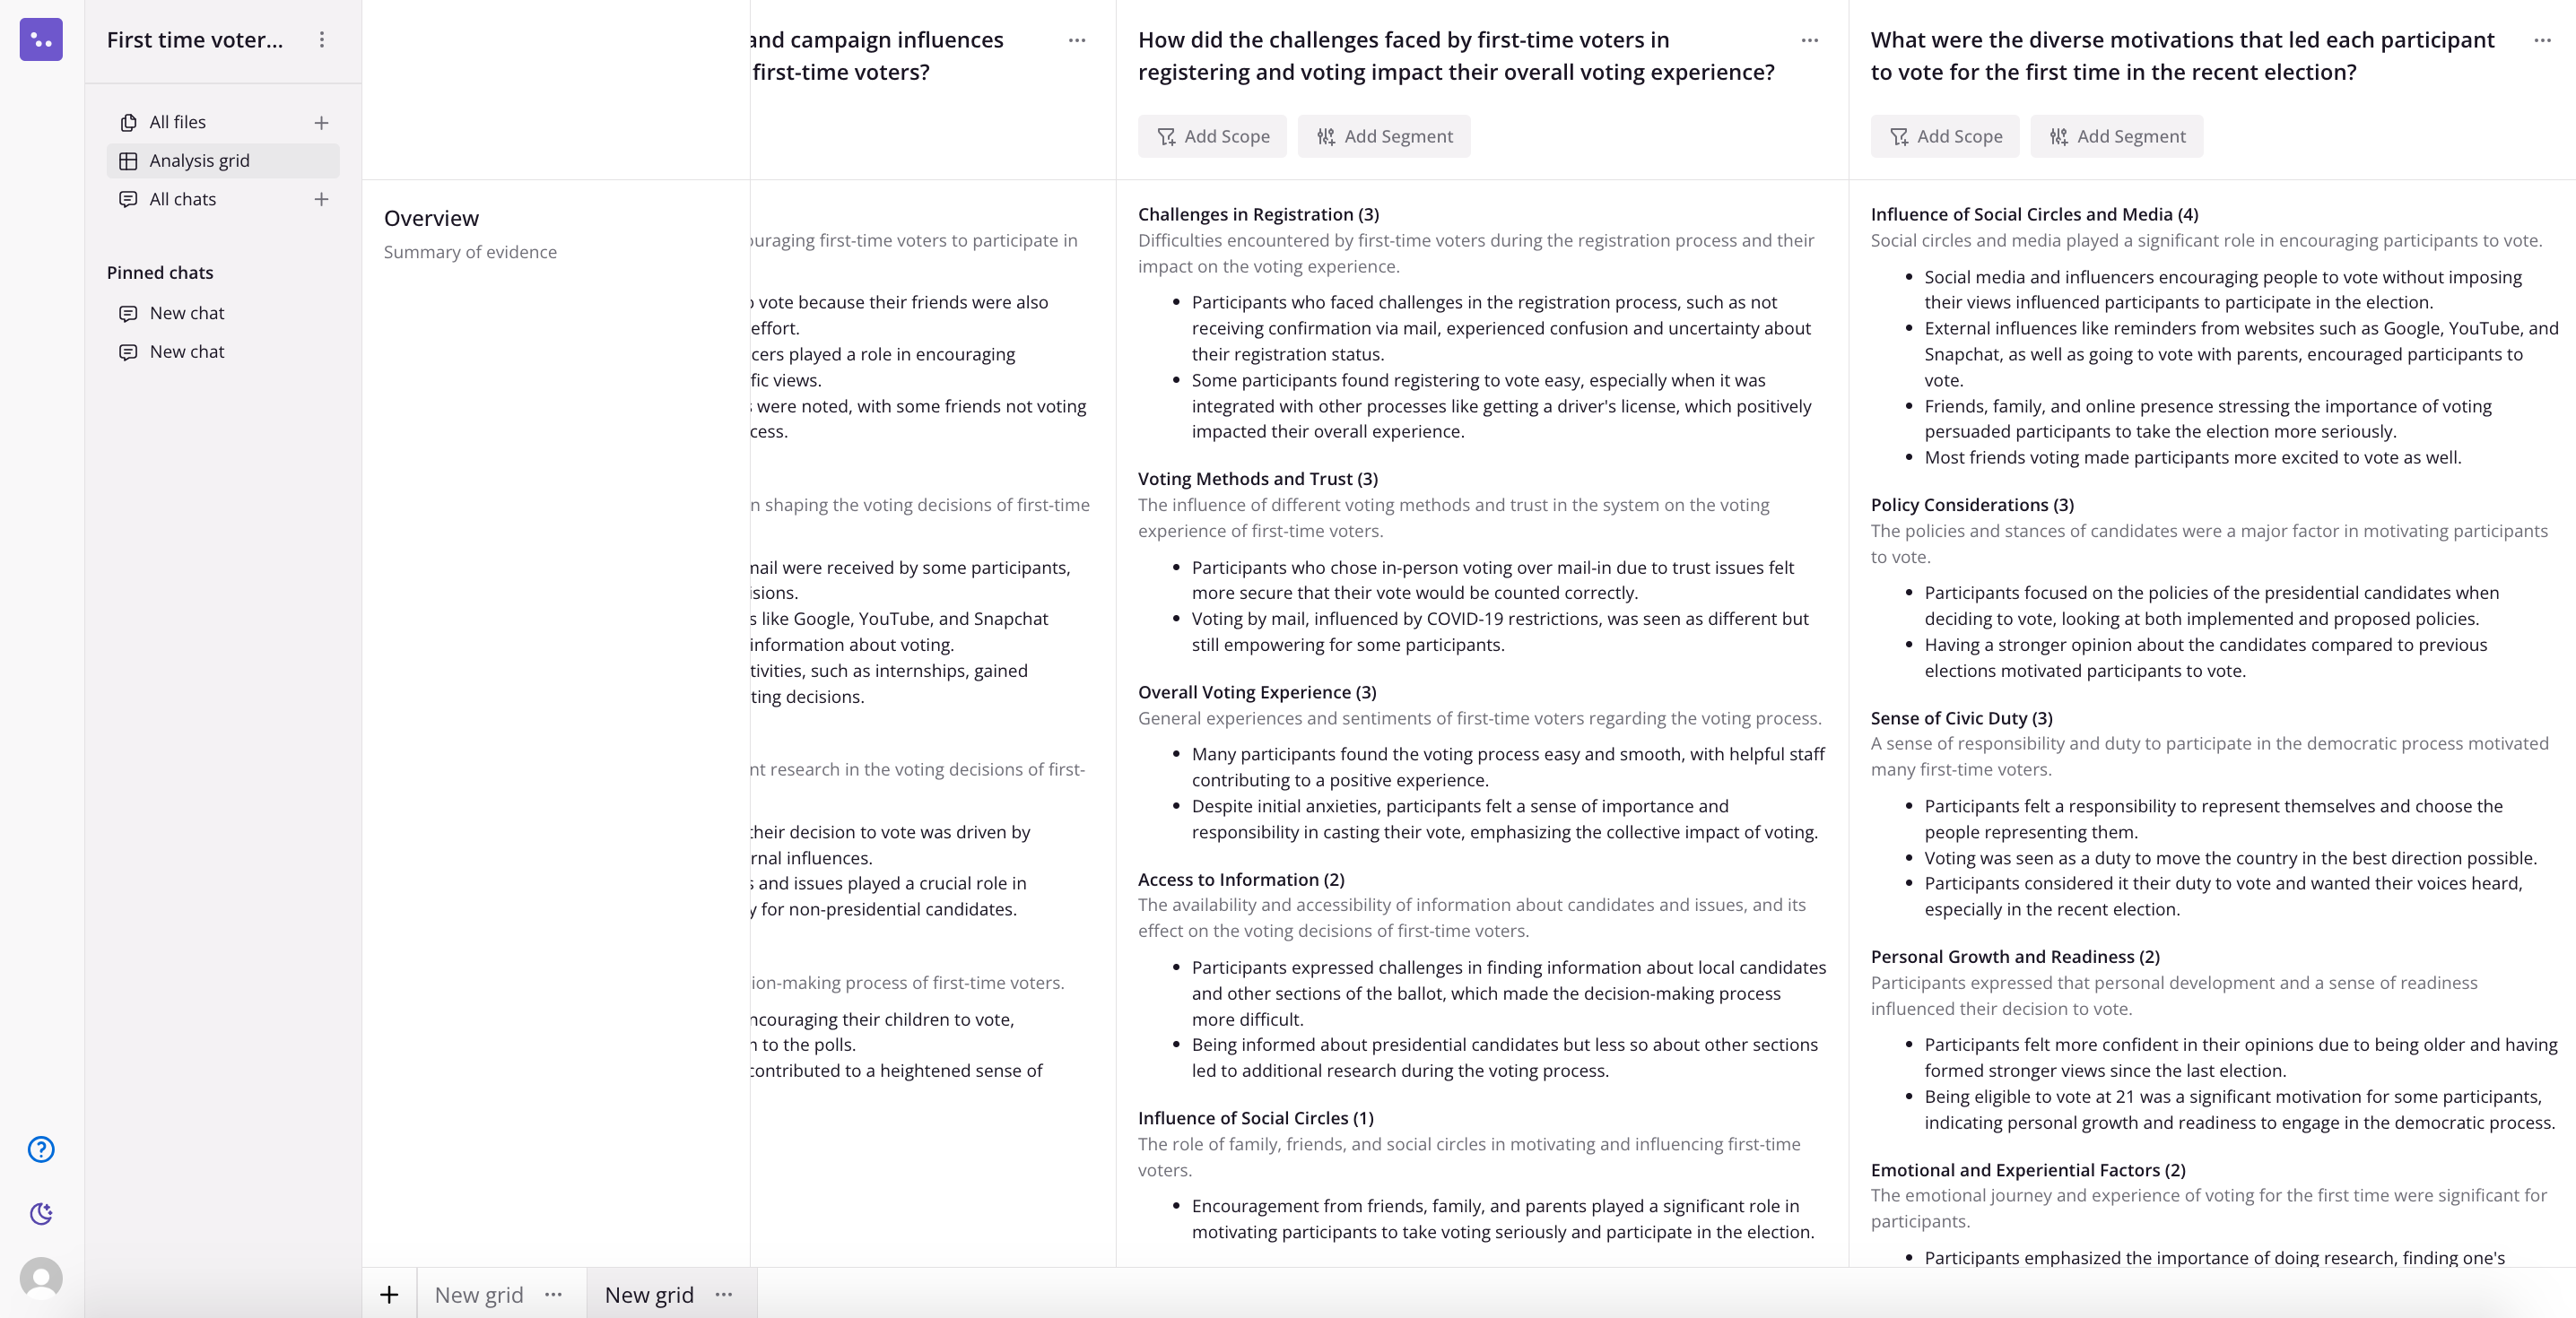
Asking questions
Suggested questions are based on the discussion guide provided in the project set up
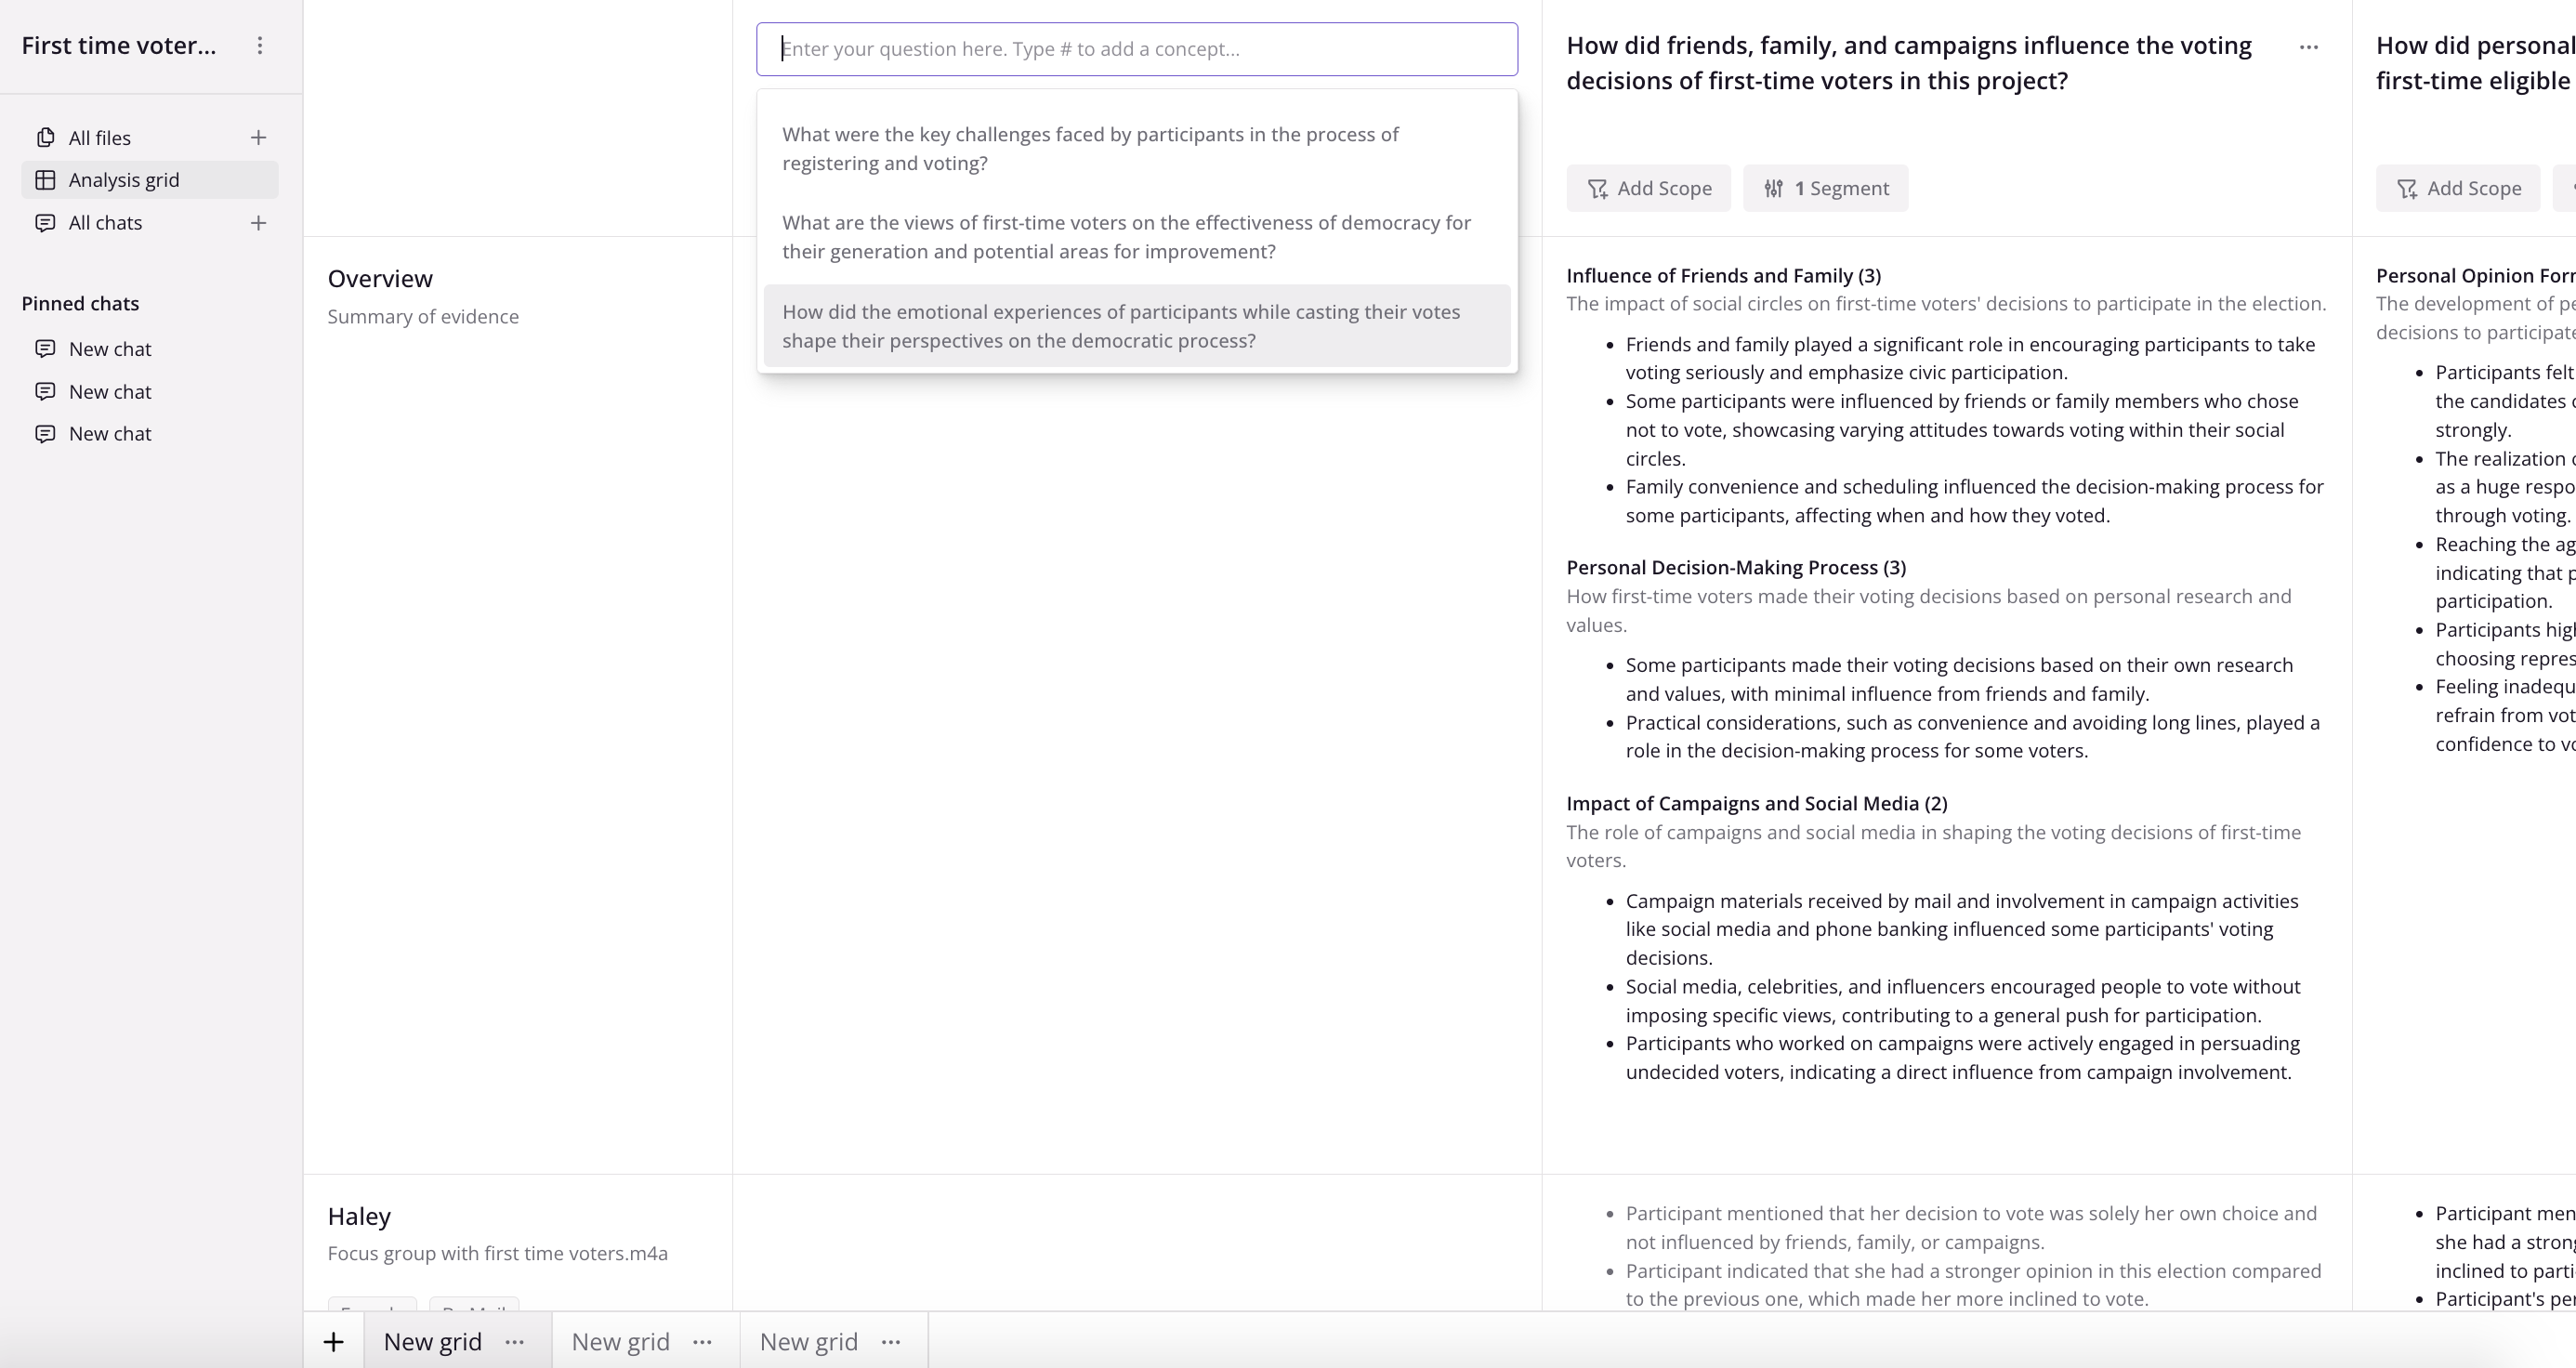
- Click in the text field at the top of the analysis grid to enter a question or choose a suggested one from the list below.
- The analysis grid will generate an answer for each row intially
- Then it will generate an overview at the top breaking down the key themes
- Numbers next to each of the theme titles correspond to the number of participants that mentioned something related
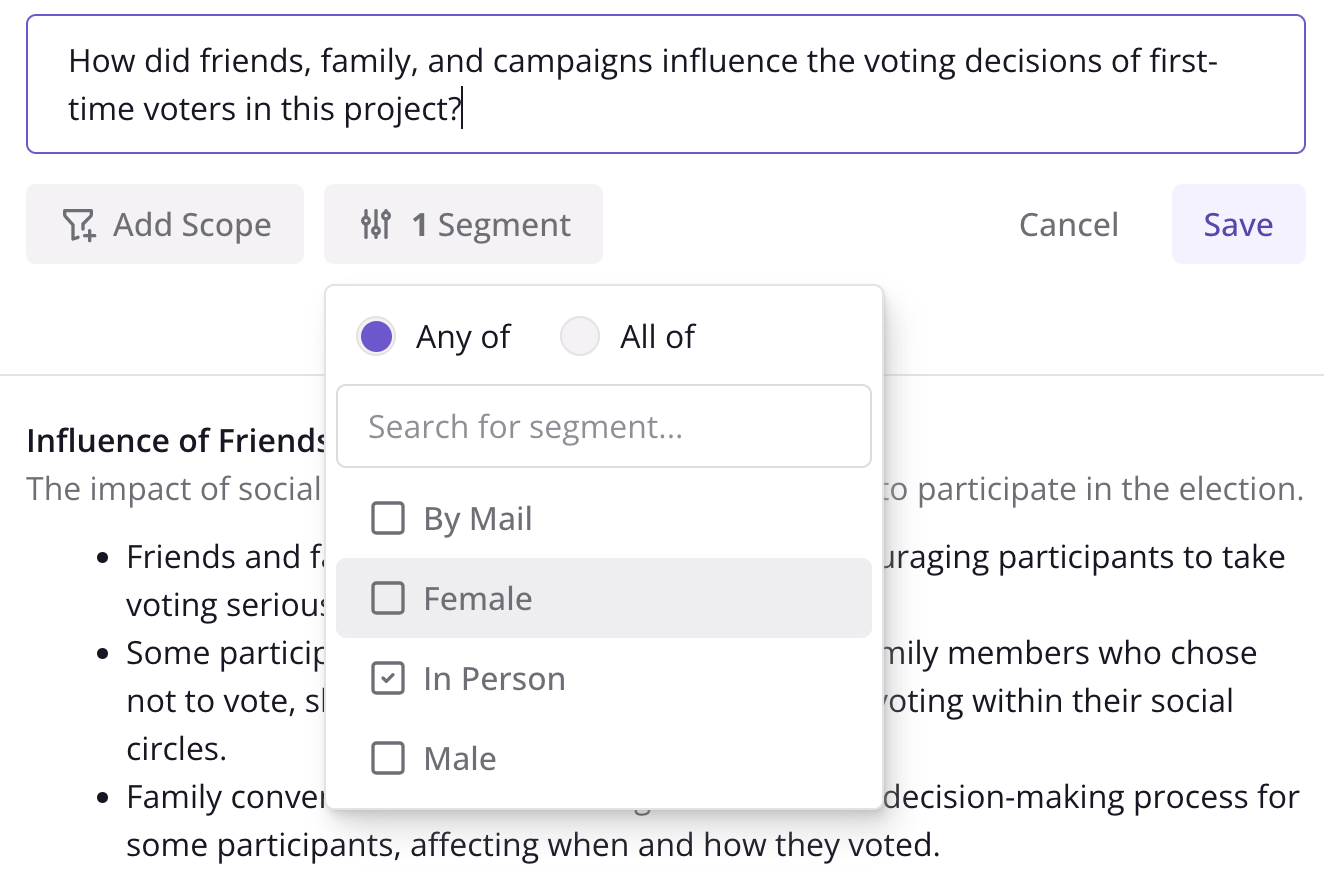
Filtering on segments
Suggested questions are based on the discussion guide provided in the project set up
- Filtering on a segment will regenerate the overview to just focus on a particular segment.
- Rows that fall outside the segment will appear grayed out
- To filter on a segment click “Add filter” at the top of the column
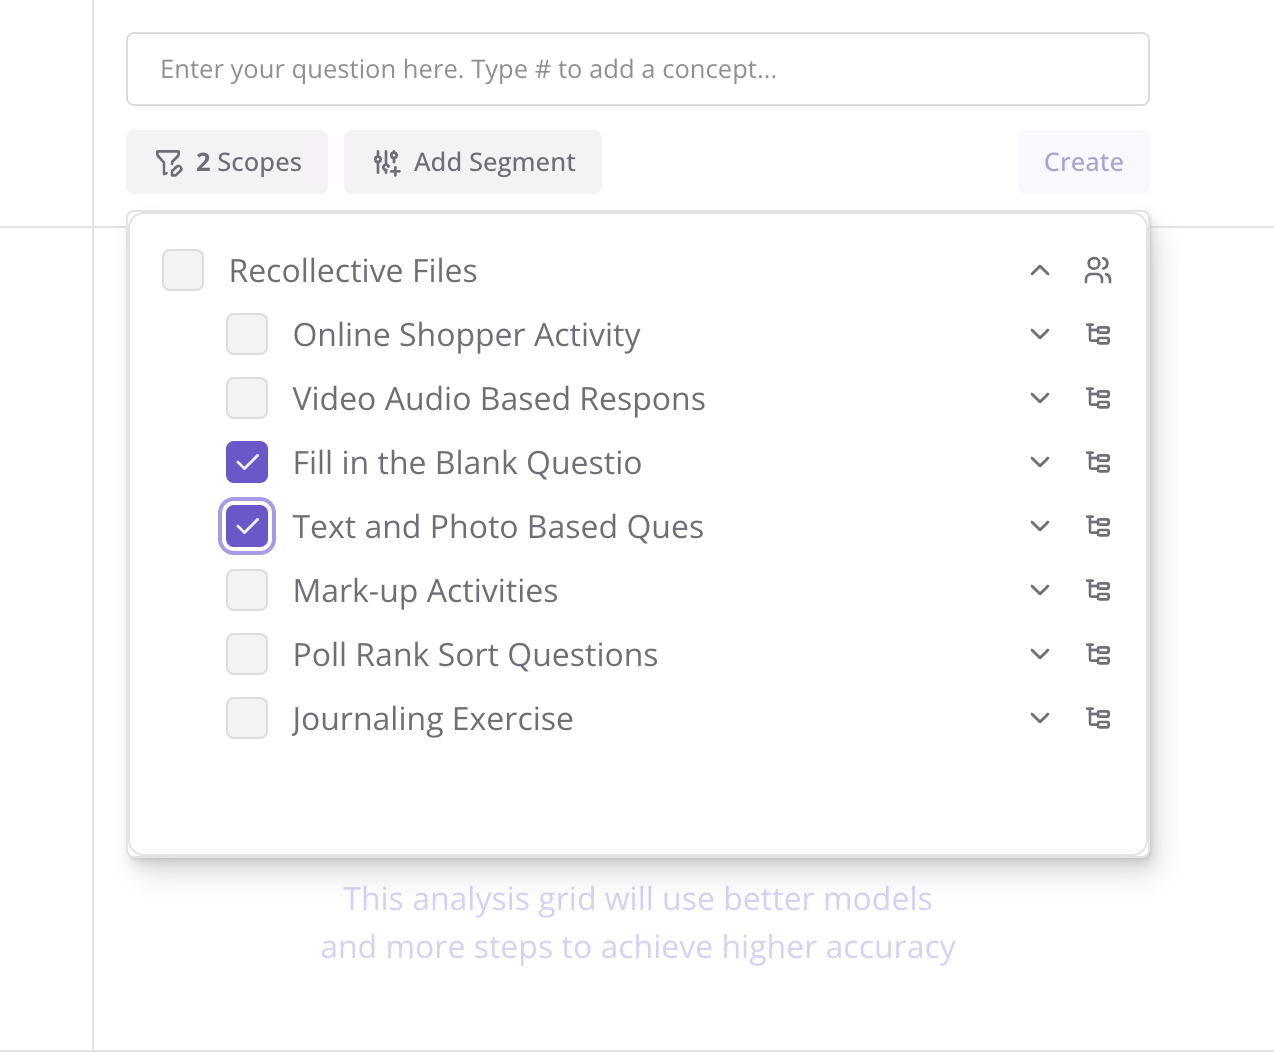
Filtering on tasks, files, questions or activities
- Basic analysis grids can also be scoped to specific files, tasks and activities
Creating multiple analysis grids
Click on the plus ”+” sign in the bottom row to create another analysis grid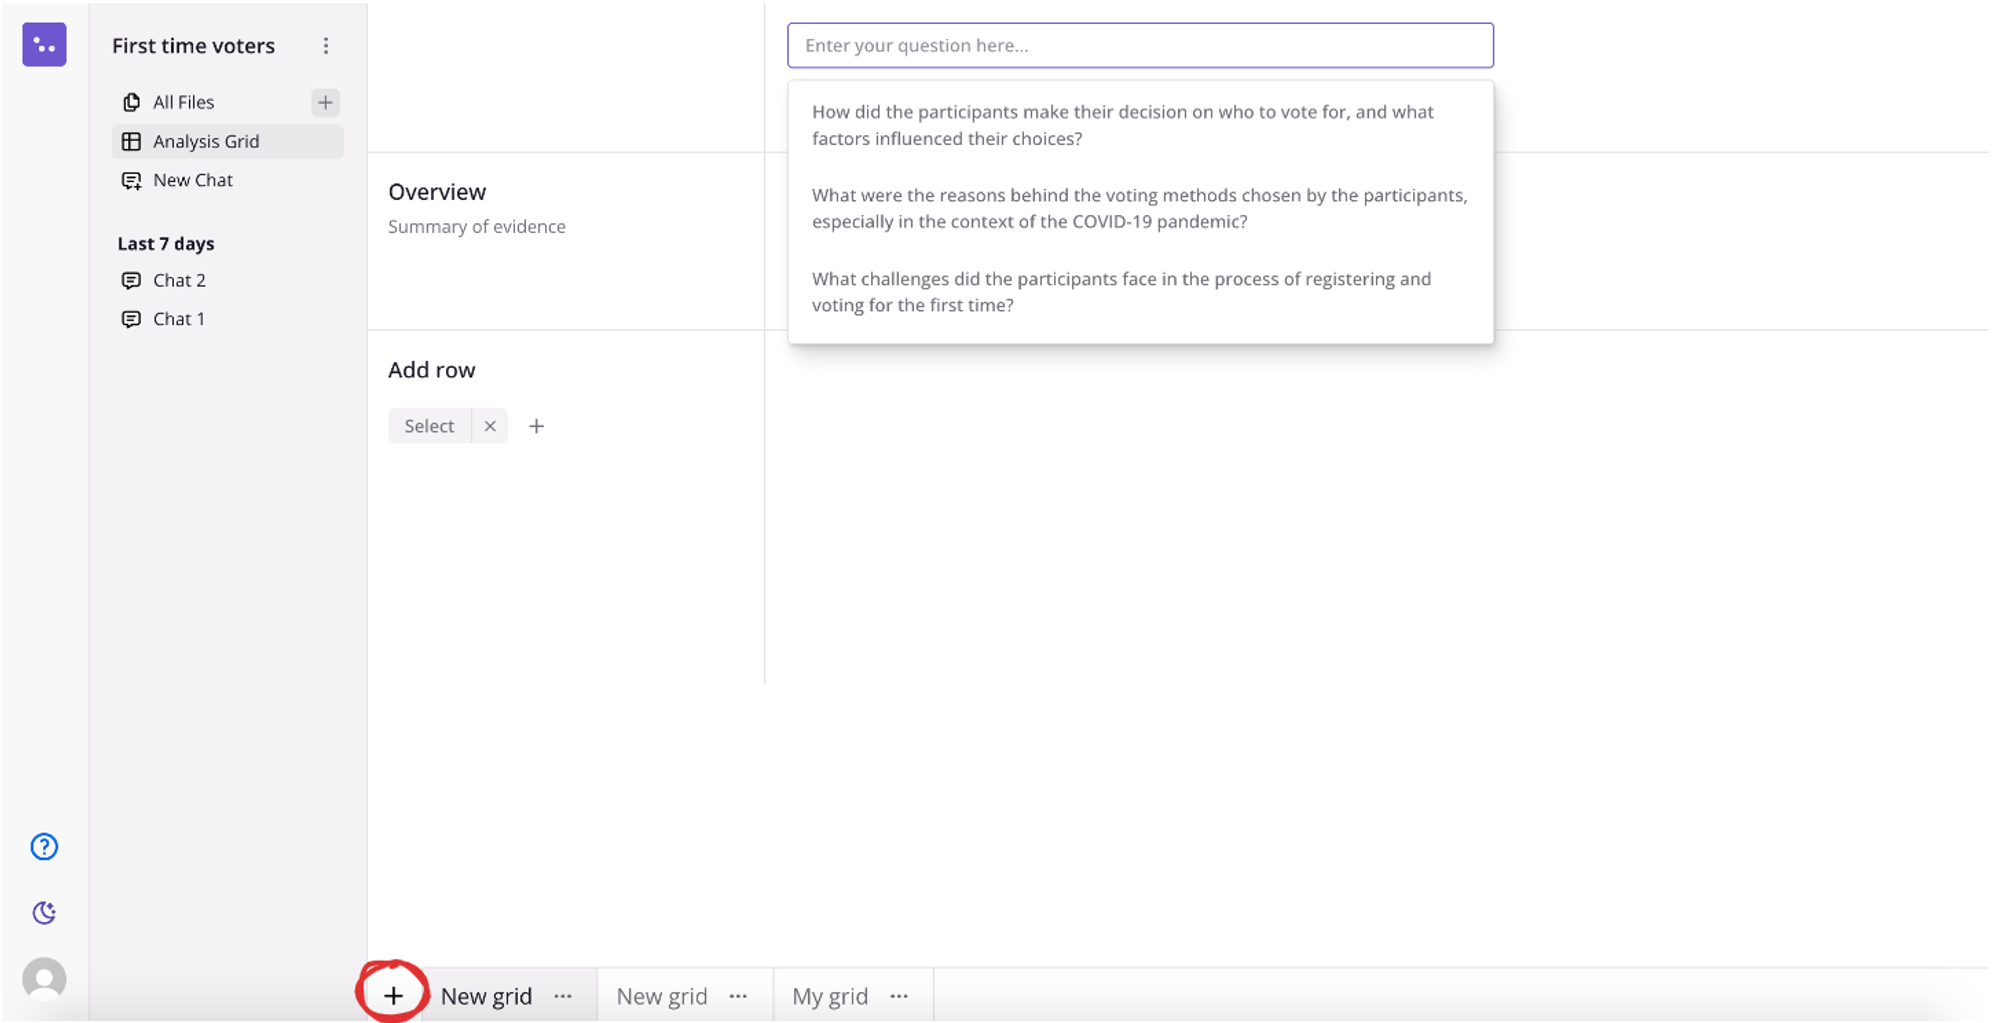
Renaming analysis grids
Rename analysis grids to keep things organised by clicking the 3 dots next to the page name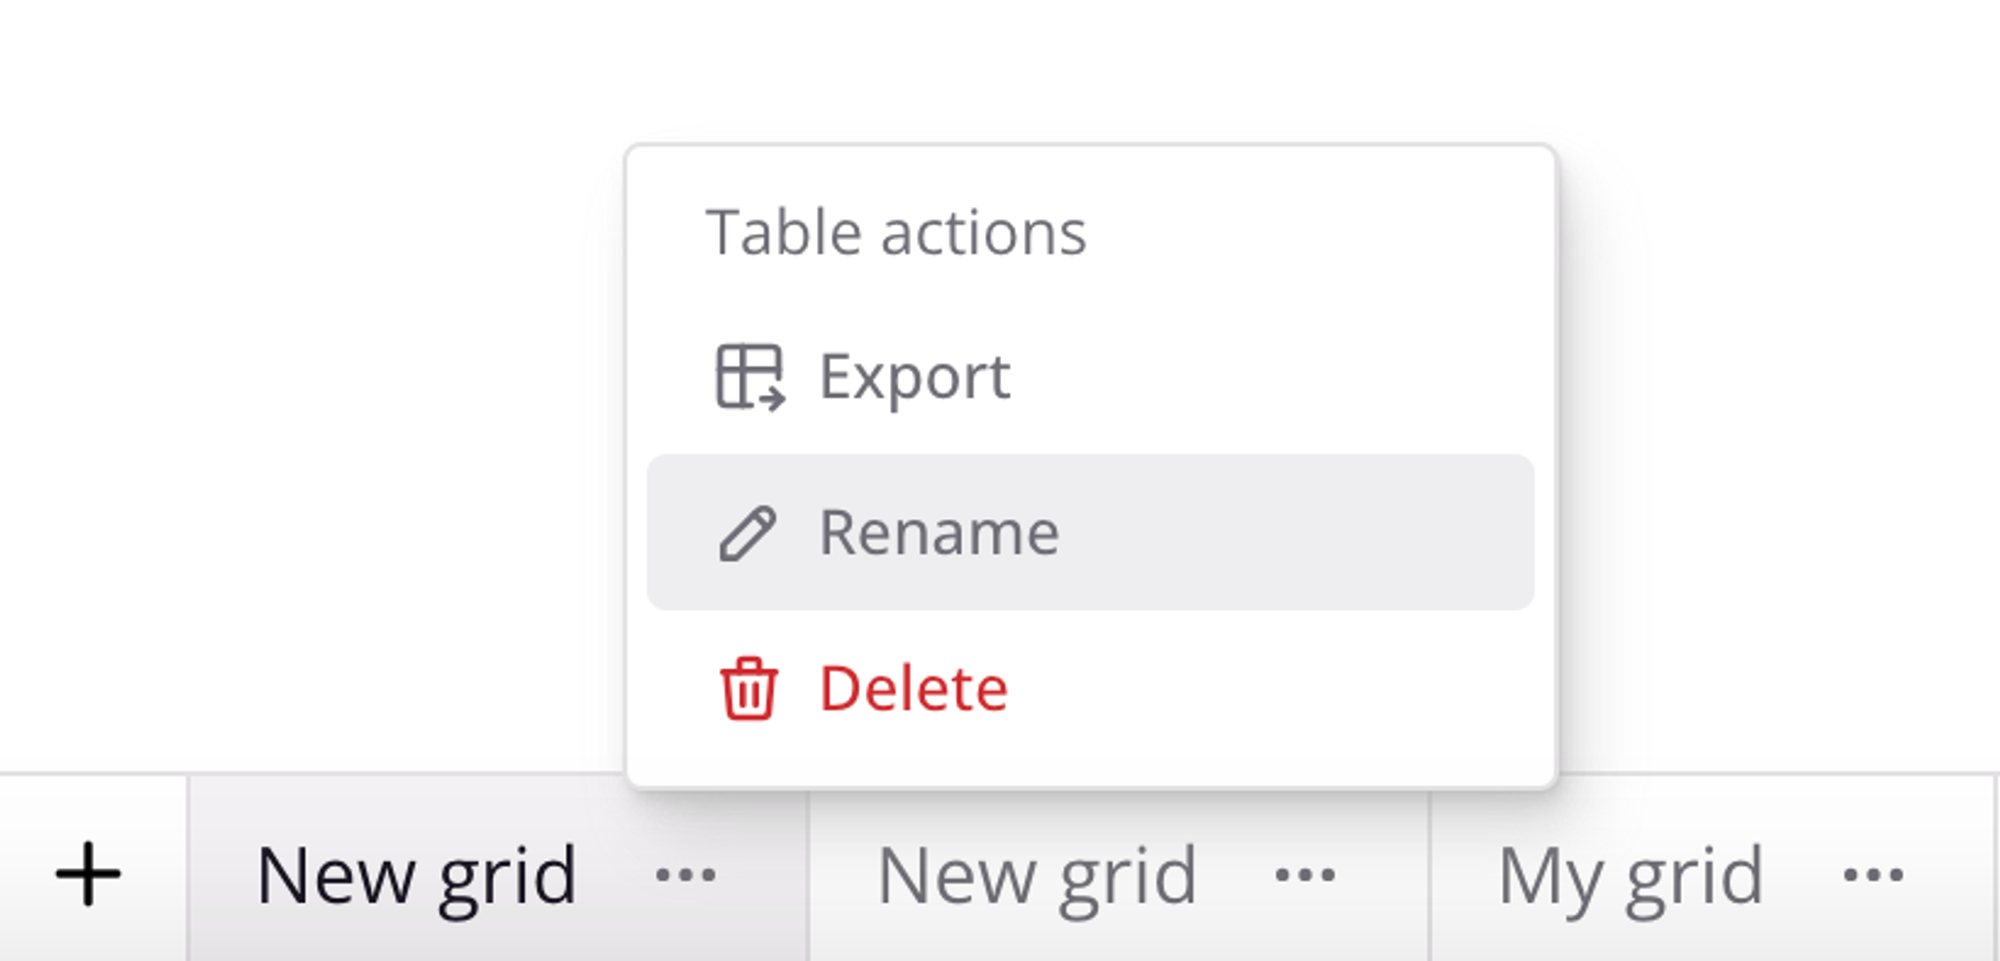
Writing good prompts
CoLoop simplifies the process by providing you with suggested questions, eliminating the need to craft the perfect prompt. Refer to this article for best practices when writing prompts.Getting the supporting quotes
You can click on any of the generated outputs from the analysis grid to see the supporting quotes. The returned list of quotes will consist of the top x supporting quotes.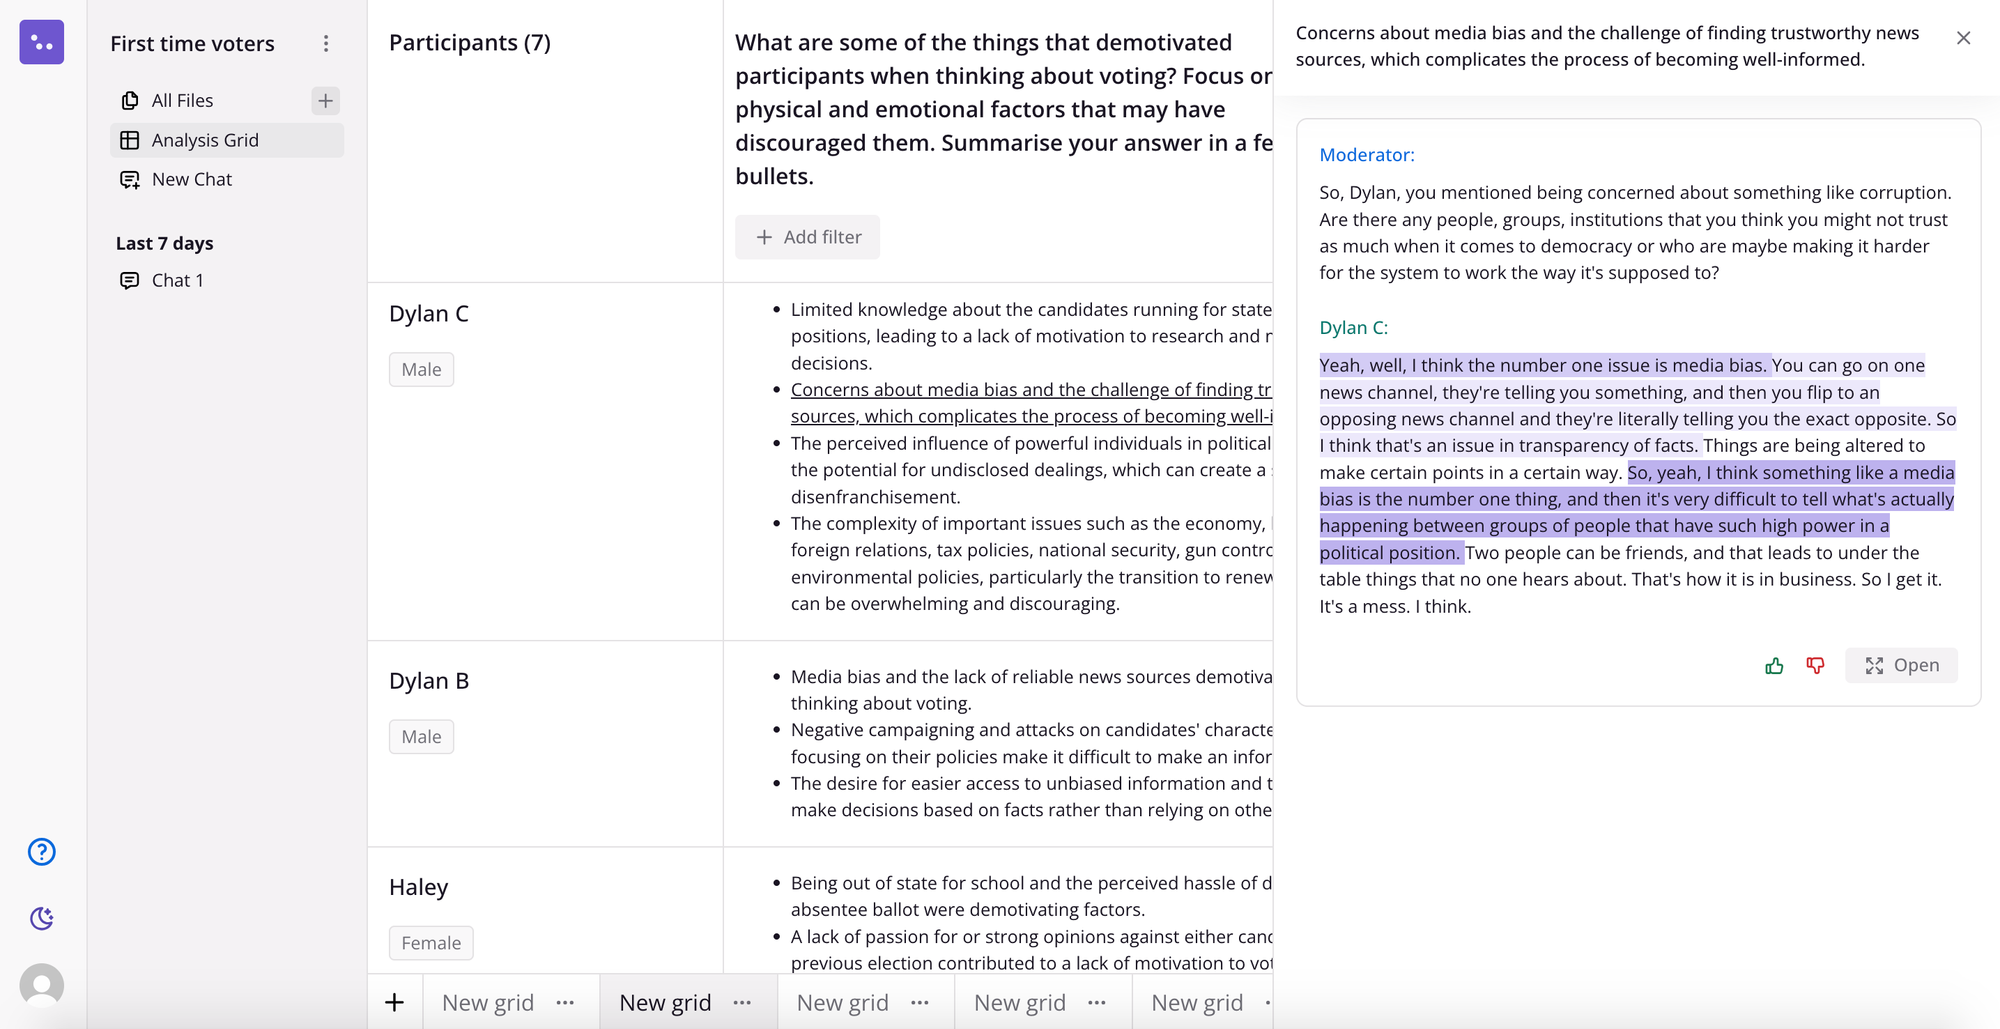
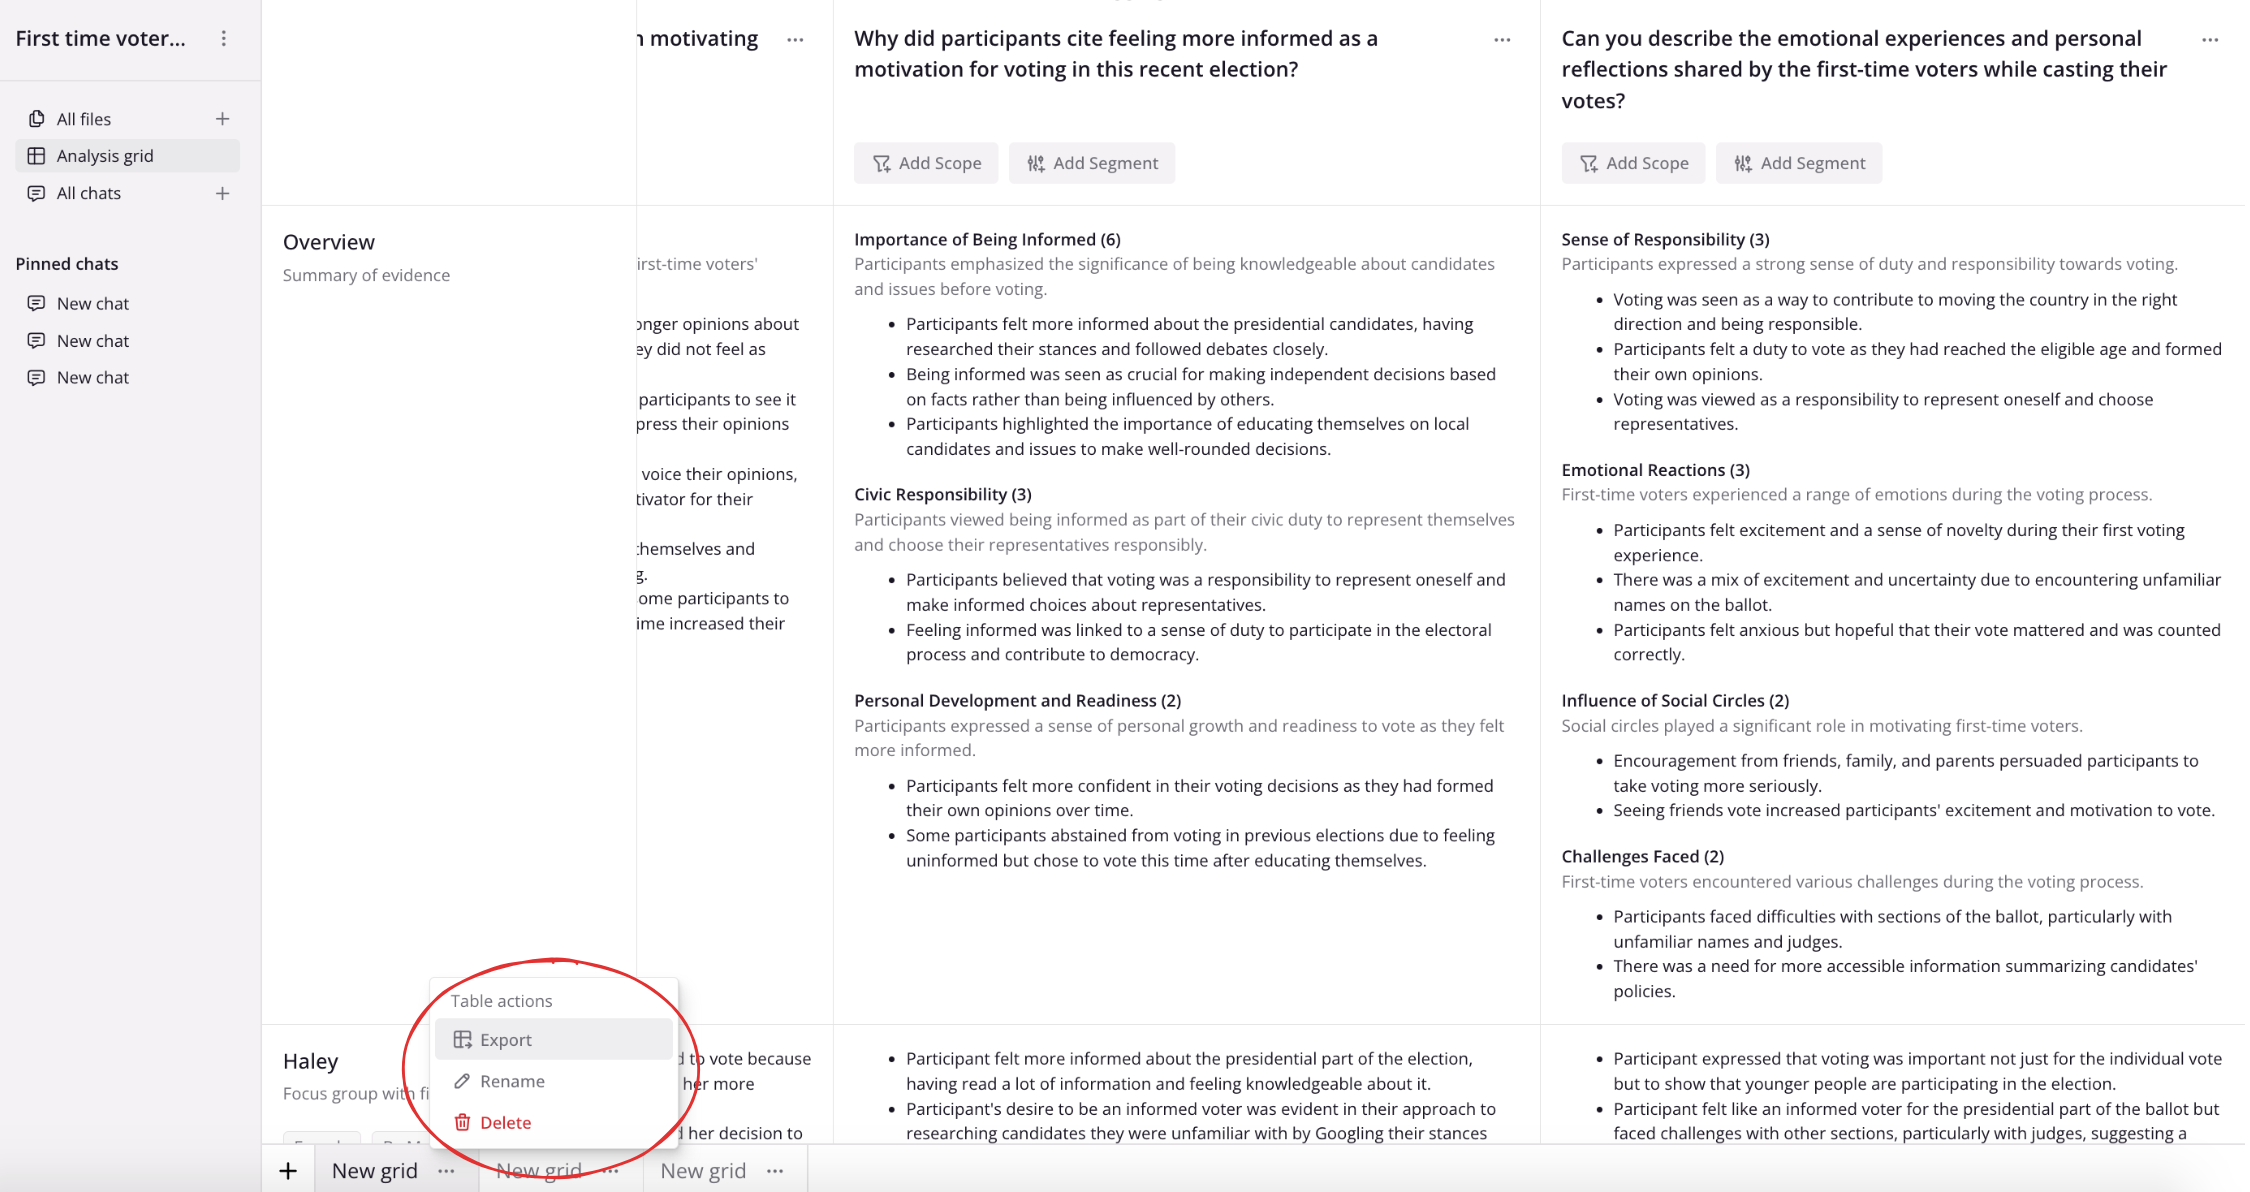
Exporting from the analysis grid
You can export your generations from the analysis grid either by copying the columns and pasting them into an Excel sheet or Word document for instance or by exporting the entire table as an Excel sheet.Copying an entire column
These can be pasted into Excel, Word, Powerpoint and more.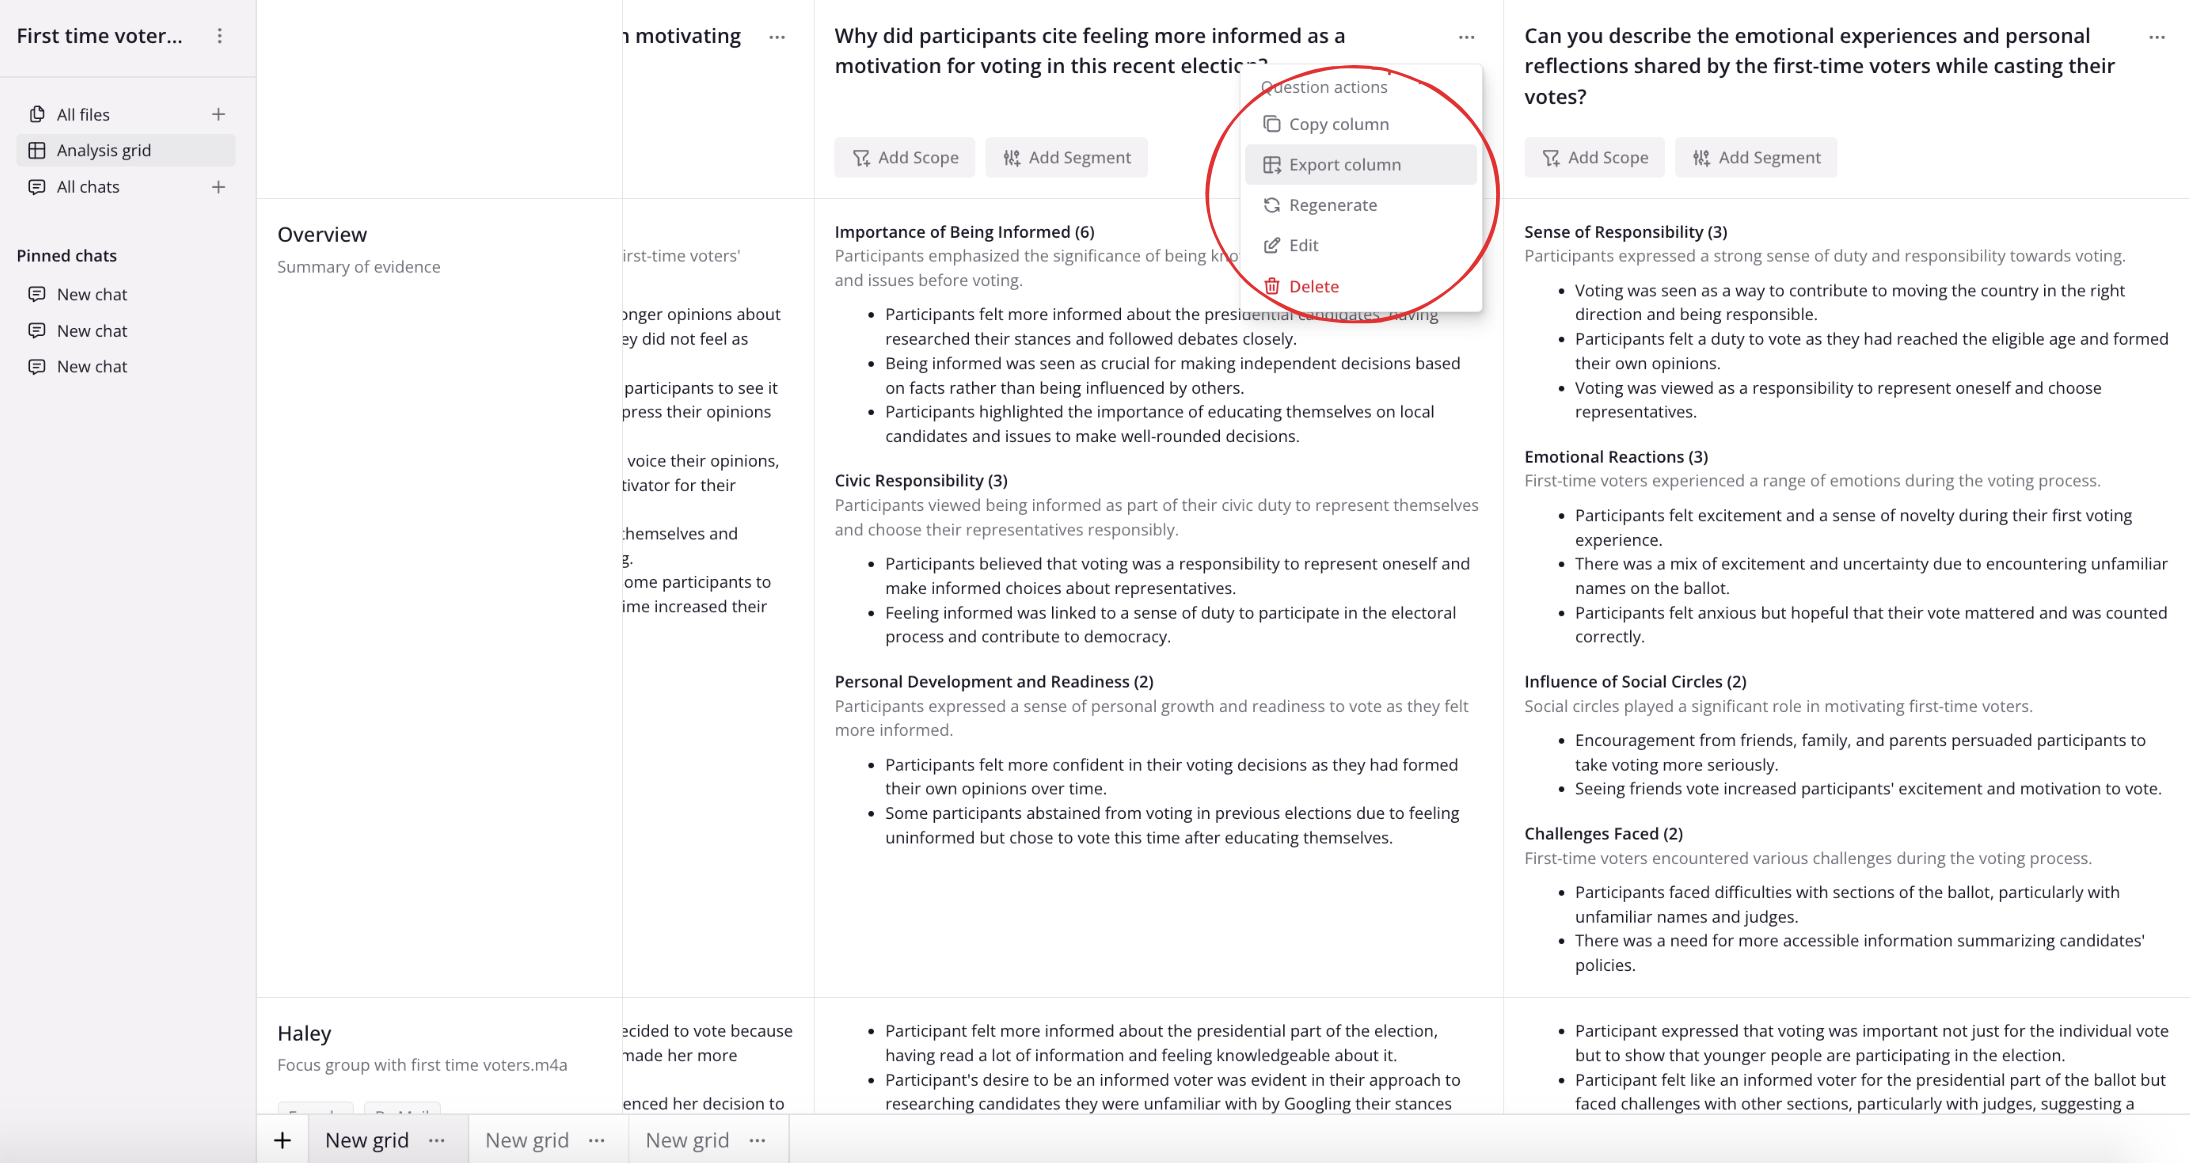
Exporting the entire table
Exports from the table are in standard Excel format (XLSX)