

Comparative grids are read-only. Open one and click Clone to new grid to copy its
rows and columns into an analysis grid, where you can
build the same custom rows and keep editing.
What you can still do
Open a comparative grid from the Analysis Grids section to:- Read every row’s summary and the overview at the top of each column
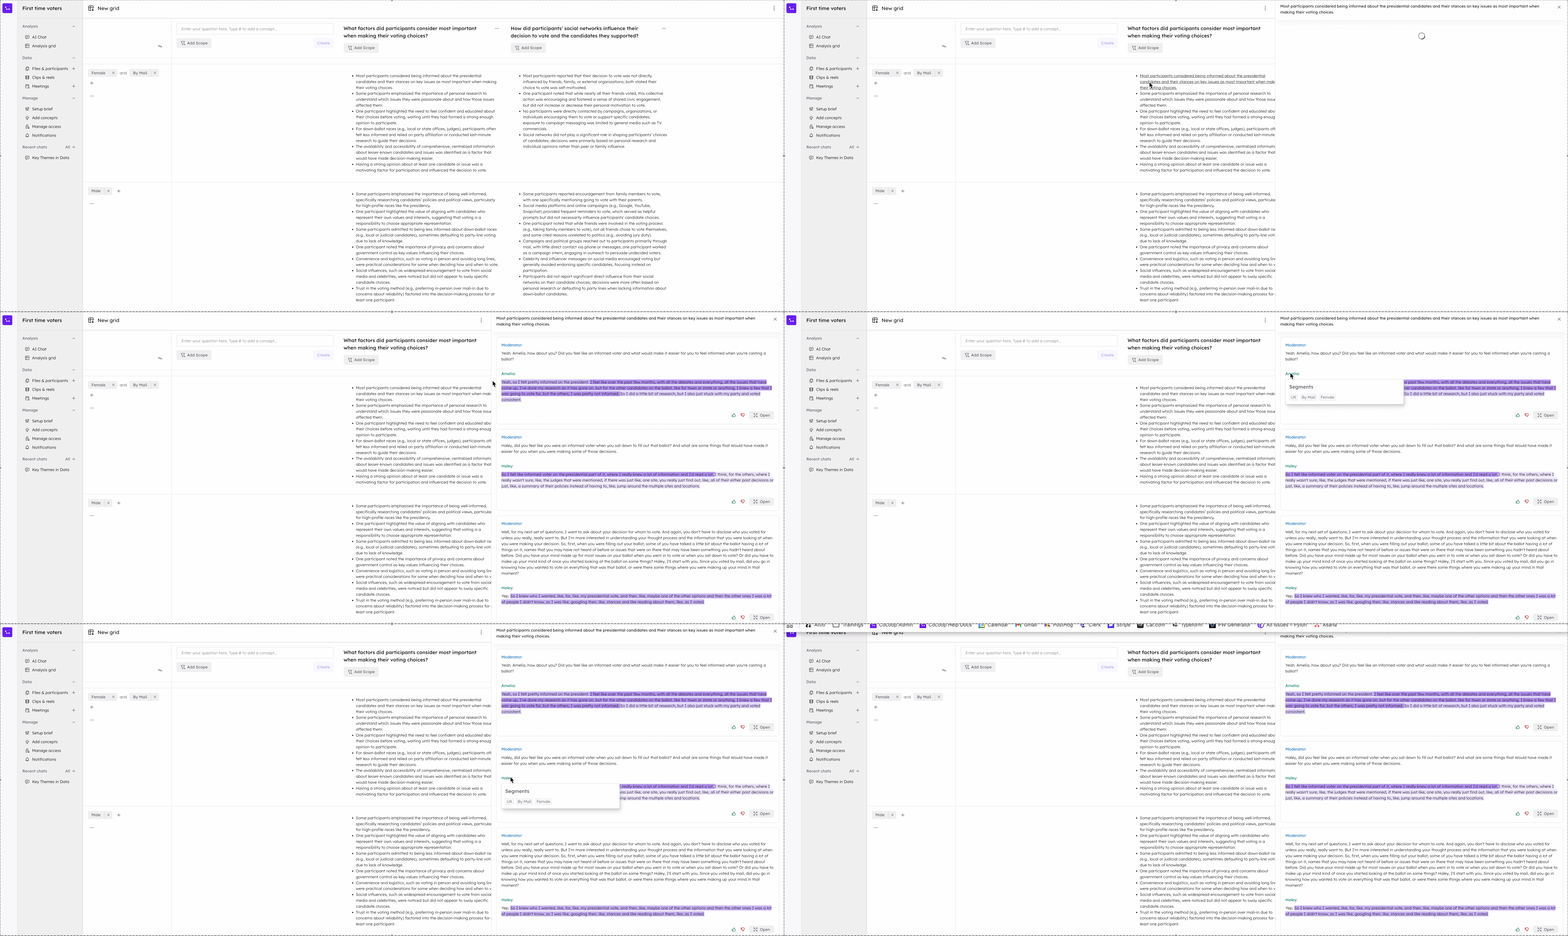
- Click any bullet point to see which participants were bucketed into it, and hover a participant name to check their segments
- Click an answer to see the supporting quotes
- Copy a column, or export the whole grid
- Reorder or delete columns, and rename or delete the grid
- Clone it into a new analysis grid to continue the analysis
What is no longer available
- Creating a comparative grid
- Adding a row, or editing a row’s segment and participant filters
- Adding, editing, or regenerating a question
Cloning into an analysis grid
Click Clone to new grid to copy the grid’s rows and columns into a new analysis grid, which then computes them in the current format. Two things can change during the copy, and CoLoop tells you how many when it happens:- Rows whose filter no longer matches anyone are skipped. A row built on a deleted participant or an emptied segment resolves to nobody, so it is dropped rather than copied empty.
- Duplicate rows and columns are merged. If two rows or two questions were identical, the new grid keeps one.